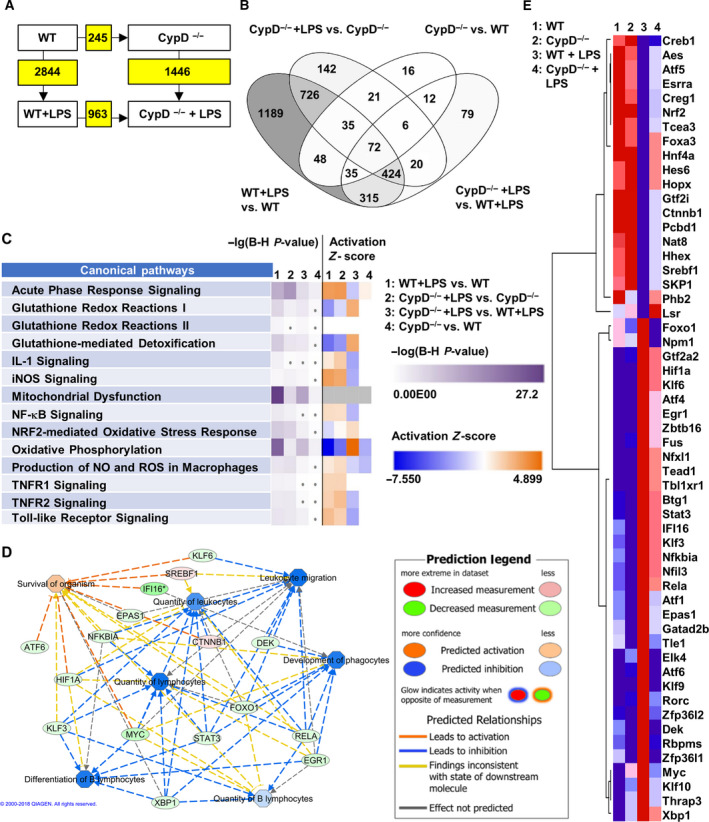
Fig. 2.

Cyclophilin D disruption alters gene expression reprogramming following LPS exposure in mouse liver. (A) Number of DEGs among the given comparisons. Kal’s Z‐test, adjPval < 0.05, [FC] > 1.5. (B) Venn diagram demonstrates proportions of DEGs among each of the comparisons (n = 5). (C) Comparing the LPS‐induced changes in WT and CypD−/− mice for the pathways we analyze in detail in this work. Purple shades represent –lg of adjPval for the enrichment in the given pathway. Orange and blue shades represent predicted activation or suppression of the given pathway, respectively, by Z‐scores calculated based on the expressional changes (n = 5). (D) Modeling the effect of a subset of differentially expressed transcription factors in LPS‐stressed groups on immune cell activation and organismal survival. Legend is provided in the figure. (E) Heat map representing the expression tendencies of transcription factors differentially induced in expression by LPS in WT and CypD−/− mouse livers by at least a 1.5‐fold expression level change and adjPval. < 0.05 (n = 5).
