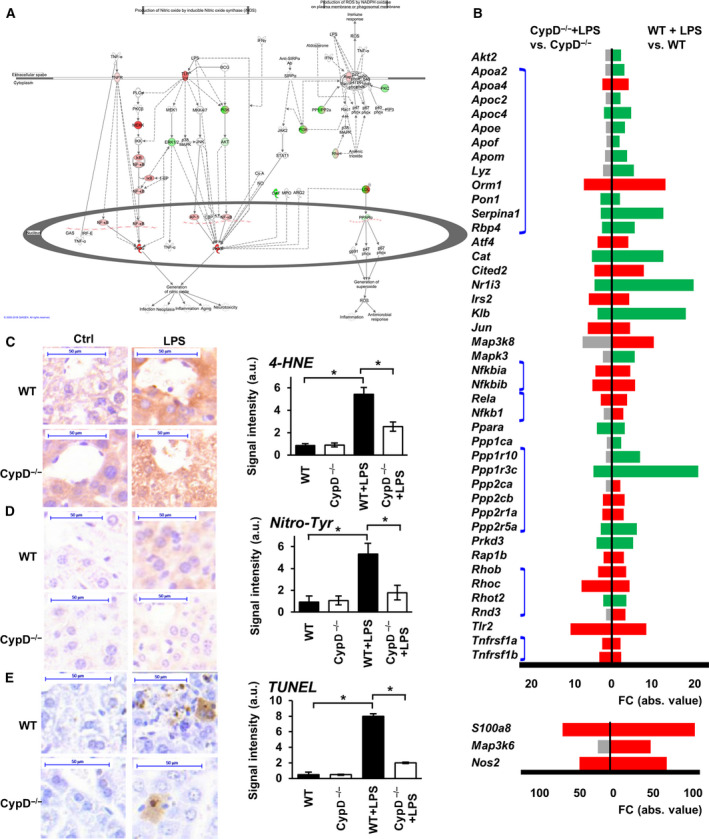
Fig. 4.

Effect of CypD deficiency on processes of ROS and NO production in LPS‐induced sterile shock. (A) Visualizing DEGs on the production of ROS and NO in macrophages pathway in LPS‐stressed WT animals. Red signs show upregulated genes while green signs represent downregulated genes. Genes with no significant changes labeled with white background. (B) Effect of CypD deficiency on the LPS‐induced DEGs of ROS and NO producing pathway. Red bars show significantly upregulated genes, green bars represent downregulated genes and gray bars show genes not significantly affected. Kal’s Z‐test, adjPval < 0.05, [FC] > 1.5. Blue lines connect individual members of complexes (n = 5) in order, from top to bottom: LDL compl., I‐κB compl., NF‐κB compl, PP1/PP2a compl., Rho compl., TNF receptor compl.) Please notice, genes with high FC values are presented on a different scale. (C) Effect of CypD deficiency on the LPS‐induced lipid peroxidation characterized by protein‐bound 4‐hydroxynonenal in WT and CypD−/− mouse livers (scalebar = 50 µm). (D) Effect of CypD disruption on the LPS‐induced nitrosylation characterized by the formation of protein nitrotyrosine adducts in WT and CypD−/− mouse livers (scalebar = 50 µm). (E) Effect of CypD deficiency on the LPS‐induced DNA break accumulation determined by TUNEL labeling in WT and CypD−/− mouse livers (scalebar = 50 µm). The bar diagrams with the mean ± SEM of at least three animals are presented, *P < 0.05, one‐way ANOVA followed by Bonferroni post hoc comparisons.
