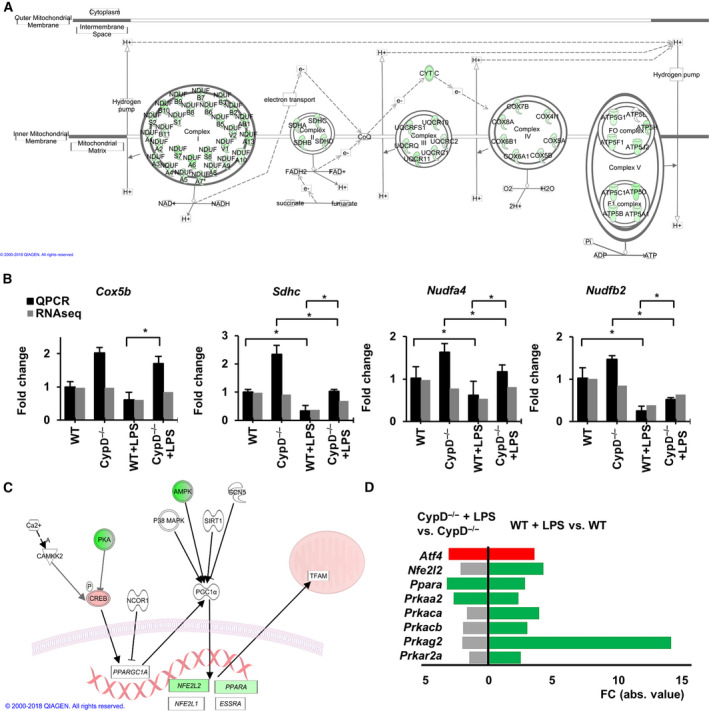
Fig. 6.

CypD disruption attenuates LPS‐induced alterations of the mitochondrial content. (A) Visualizing LPS induced DEGs on IPA oxidative phosphorylation pathway in WT mice (modified). Green signs represent significantly downregulated gene. Only those genes are shown which were differentially expressed due to LPS exposure. Kal’s Z‐test, adjPval < 0.05, [FC] > 1.5. (B) qPCR validation of RNA‐Seq data for Cox5b, Sdhc, Ndufa4, and Ndufb2 mRNA expression. Data are presented as mean ± SEM of FC values normalized to the expression in WT mice (n = 5). *P < 0.05, one‐way ANOVA followed by LSD post hoc comparisons on qPCR data. (C) Visualizing the LPS‐induced changes on the transcriptional regulators of mitochondrial protein synthesis pathway in WT mice liver. Red signs show significantly upregulated genes while green signs represent significantly downregulated genes and genes with no significant changes labeled white background. (D) Effect of CypD deficiency on the differential expression of regulators of mitochondrial biogenesis pathway. Red bars show significantly upregulated genes, while green bars represent downregulated genes, and gray bars show genes not significantly affected (n = 5) Kal’s Z‐test, adjPval < 0.05, [FC] > 1.5.
