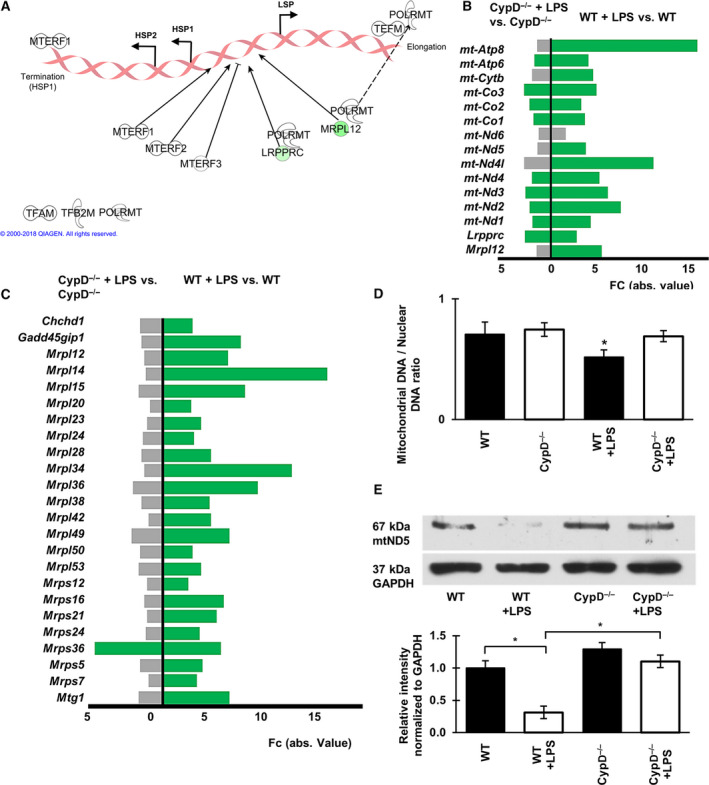
Fig. 7.

CypD deficiency attenuates LPS‐induced alterations regarding processes of mitochondrial replication in the sterile shock model. (A) Effect of CypD deficiency on the LPS‐induced alterations of regulators of transcription from mtDNA. Green symbols represent downregulated genes, while white symbols show genes not significantly affected. (B) Fold change values of LPS‐induced DEGs in the mitochondrial transcription regulators and mtDNA‐encoded genes in WT and CypD−/− mice. Green bars represent downregulated genes gray bars show genes not significantly affected, (n = 5), Kal’s Z‐test, adjPval < 0.05, [FC] > 1.5. (C) Bar graph demonstrating DEGs for mitochondrial ribosomes and accessory proteins in LPS‐exposed WT and CypD−/− mouse liver tissues. Green bars represent downregulated genes gray bars show genes not significantly affected, (n = 5), Kal’s Z‐test, adjPval < 0.05, [FC] > 1.5. (D) The effect of CypD disruption on LPS‐induced changes of mtDNA levels relative to nuclear DNA content in liver tissues during endotoxemia, determined by qPCR. Data are presented as mean ± SEM, (n = 5), *P < 0.05, one‐way ANOVA followed by Bonferroni post hoc comparisons. (E) Western blot analysis of the effect of CypD disruption after LPS exposure on the cellular level of mitochondrial protein complex I component, mtND5. Data are presented as mean ± SEM (n = 5), *P < 0.05, one‐way ANOVA followed by Bonferroni post hoc comparisons.
