
Fig. 2.
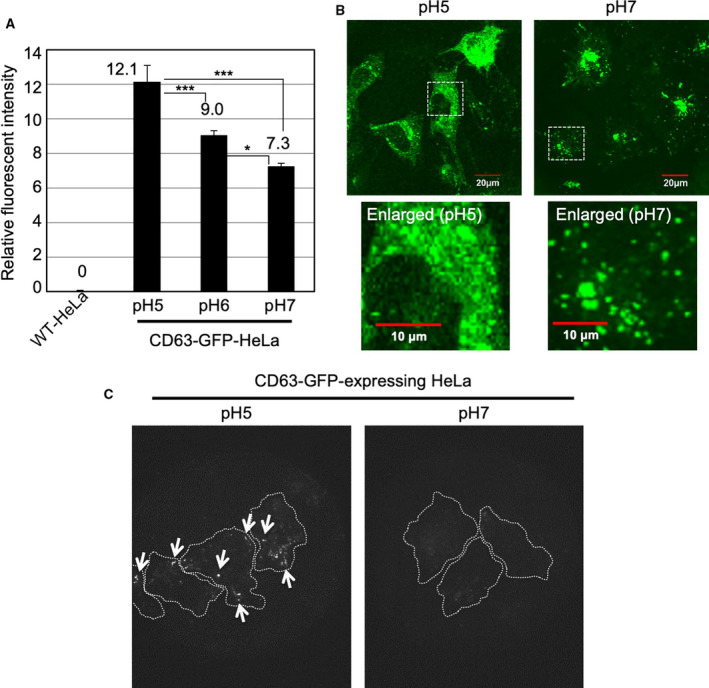
Effects of low pH cell culture condition on expression of CD63‐GFP fusion proteins. (A) Relative fluorescent intensity of CD63‐GFP fusion proteins stably expressing in HeLa cells cultured for 24 h at 37 °C in α‐MEM (pH 7, 6 or 5) with 10% FBS, analyzed using a flow cytometer (detection for 10 000 live cells). The data are expressed as the mean (± SD) of three experiments. Differences between groups were compared by one‐way ANOVA with Tukey's post hoc test. *P < 0.05, ***P < 0.001. (B) Confocal microscopic observation of CD63‐GFP fusion proteins stably expressing HeLa cells cultured for 24 h at 37 °C in α‐MEM (pH 7 or 5) with 10% FBS. Scale bar, 20 μm (enlarged pictures: 10 μm). (C) TIRF observation of CD63‐GFP fusion proteins stably expressing HeLa cells cultured for 24 h at 37 °C in α‐MEM (pH 7 or 5) with 10% FBS. Arrows show comparatively high fluorescent intensity of CD63‐GFP fusion protein expression in comparison with that at pH 7 cell culture condition. Dotted white lines show the cellular structures.