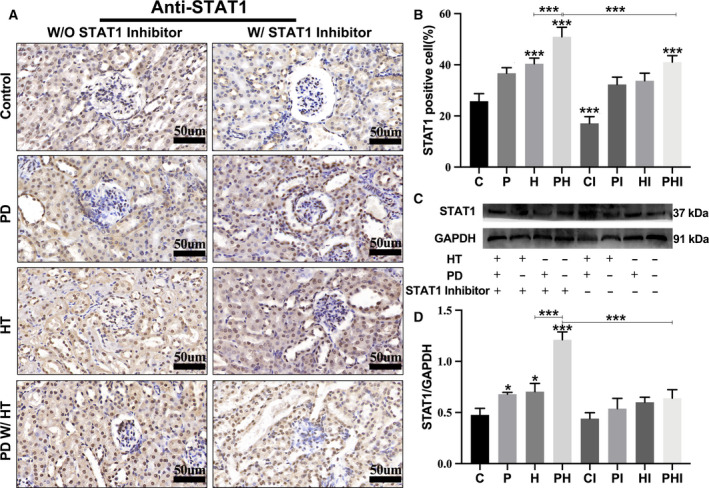
Fig. 3.

Periodontitis and hypertension upregulate the expression of STAT1 protein in mouse kidneys. (A) Immunohistochemistry of STAT1. Scale bar: 50 um. (B) Semi‐quantitative analysis of the proportion of STAT1‐positive cells in the kidneys. (C) Western blot of STAT1 protein expression, with GAPDH as the internal reference protein. (D) Relative expression of STAT1 protein in the kidneys. C, control group; CI, control + inhibitor group; P, periodontitis group; PI, periodontitis + inhibitor group; H, hypertension group; HI, hypertension + inhibitor group; PH, periodontitis + hypertension group; PHI, periodontitis + hypertension + inhibitor group. Data are presented as the mean ± SD (n = 10 per group) of independent samples, and experiments were repeated three times. Differences between two groups were compared using one‐way analysis of variance (ANOVA). *P < 0.05, **P < 0.01, and ***P < 0.001. The asterisk (with no line connection) on the column of this group represents the statistical difference between it and the control group
