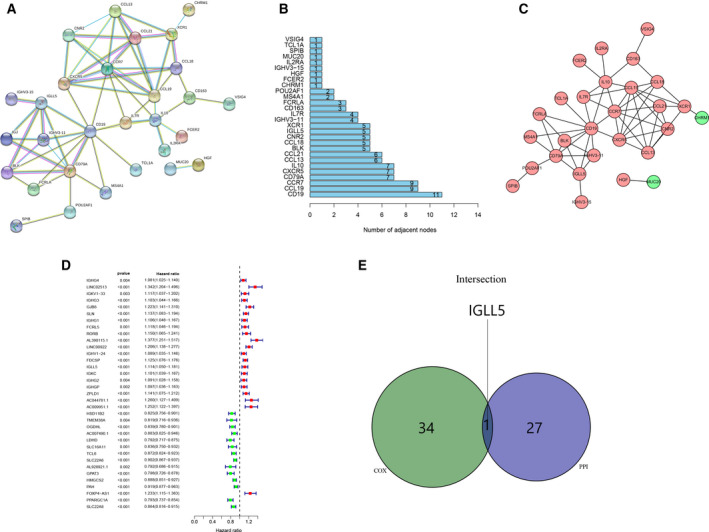
Fig. 5.

Construction of the PPI network of DEGs and identification of the prognostic hub genes. (A) A PPI network of DEGs with interaction confidence value >0.70. (B) Hub genes ranked by the number of nodes. (C) Network indicated the UR and DR genes using the Cytoscape software. (D) Forest plots listing the prognostic genes with P < 0.005. (E) A Venn diagram showing the prognostic hub gene in the PPI network and univariate Cox analysis.
