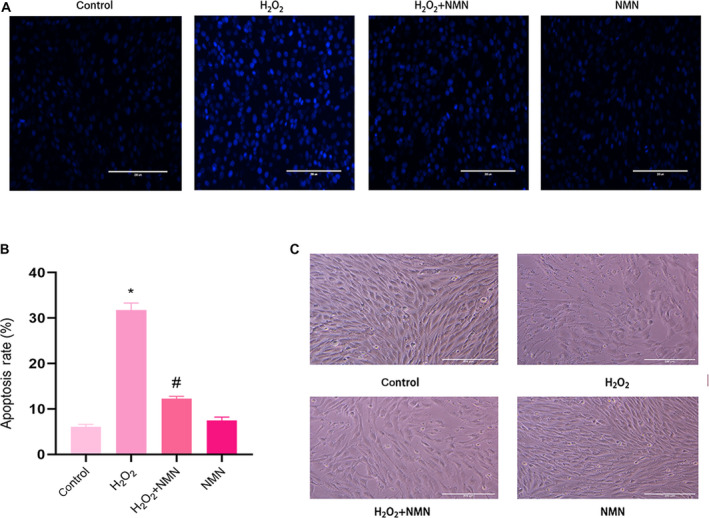
Fig. 3.

(A) Apoptosis of cells that induced by H2O2 (800 µm) and NMN (300 µm) reduced apoptosis induced by H2O2 was stained with Hoechst 33258. (B) The apoptotic and total cells were analysed by imagej software, and the apoptosis rate was presented as % of the total number of nuclei C. bEnd.3 cells were cultured with 800 µm H2O2 and 300 µm NMN (×10 scale bar = 100 μm). Results are expressed as means ± SD and are representative of three independent experiments. Data were analysed by one‐way ANOVA with LSD’s test for multiple comparisons. *P < 0.05, #P < 0.05 vs. control group. #P < 0.05, vs. 800 uM H2O2 group.
