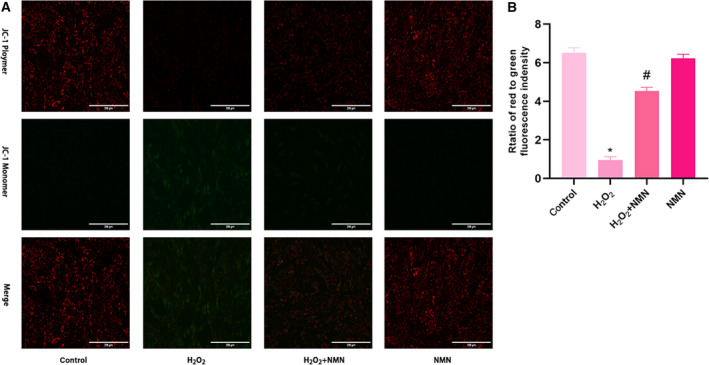
Fig. 4.

Protective effect of NMN (300 µm) on mitochondrial damage induced by H2O2 (800 µm). (A) Immunofluorescence microscopy of mitochondrial membrane potential shown by JC‐1 staining (×20; scale bar = 200 μm). (B) The ratio of red‐green fluorescence intensity indicating the mitochondrial membrane potential by JC‐1 staining. Results are expressed as means ± SD and are representative of three independent experiments. Data were analysed by one‐way ANOVA with LSD’s test for multiple comparisons. *P < 0.05 vs. the control group. #P < 0.05 vs. the H2O2 group.
