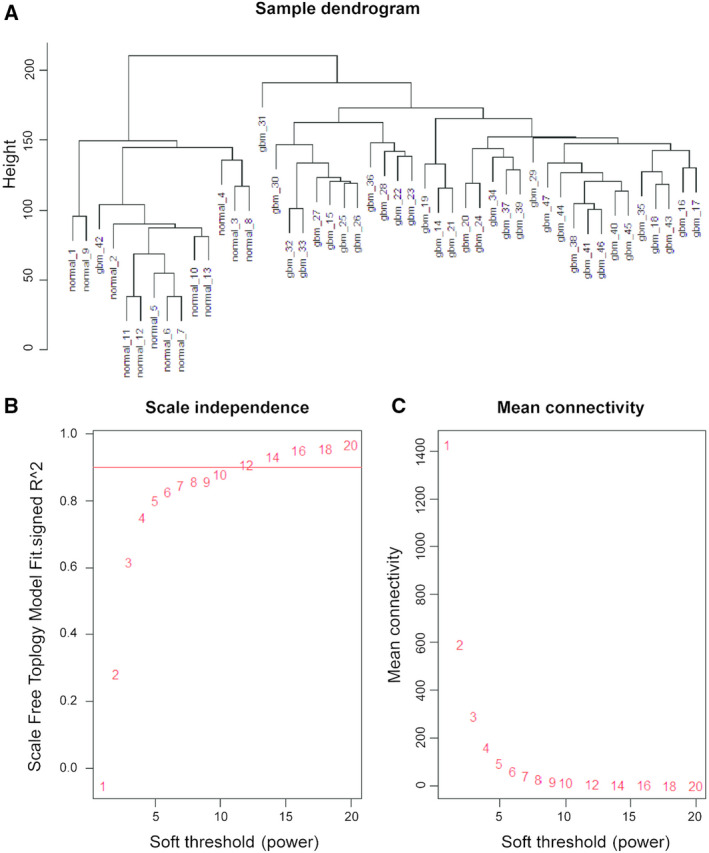
Fig. 1.

Clustering of samples and determination of soft‐thresholding power. (A) Clustering of samples. (B) The scale‐free topology fitting index (R 2, y‐axis) as a function of the soft‐thresholding power (x‐axis). The red line indicates R 2 = 0.9. (C) The mean connectivity (degree, y‐axis) is displayed as a function of the soft‐thresholding power (x‐axis). Red Arabic numbers in the panels denote different soft‐thresholds. β = 8, there was a trade‐off between maximising the scale‐free topology model fitting index (R 2) and maintaining a high mean number of connections.
