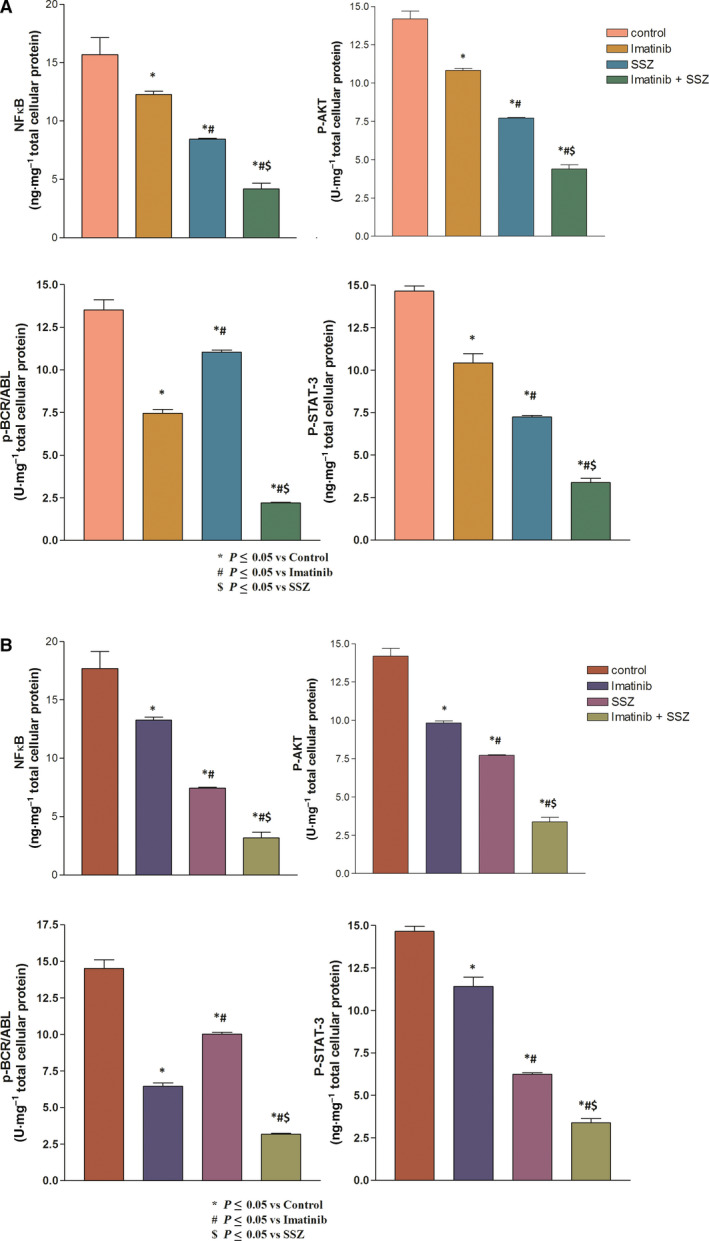
Fig. 2.

Effects of imatinib (1, 1.2 µm), sulfasalazine (SSZ) (250, 253 µm) and their combination on p‐NFκB, p‐Akt, p‐BCR/ABL, p‐STAT‐3, and caspase‐3 protein levels in (A) HEPG2 and (B) Huh‐7 cell lysates. All treatments were performed for 3 days. The results are presented as the mean ± SE (n = 4). Statistical analysis was performed using one‐way ANOVA followed by Tukey's post hoc test at P < 0.05 compared with the control (*), imatinib‐treated (#) and SSZ‐treated ($) groups.
