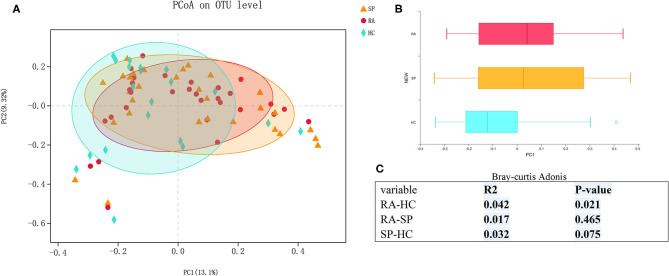
Figure 1.
β diversity among RA, SP, and HCs groups. (A) Horizontal and vertical coordinates represent two selected principal coordinate components, and the percentage represents the contributed value of theprincipal coordinate components to the difference of sample composition. Points of different colors or different shapes represent samples of different groups. The closer that two samples are to one another, the more relatively similar the species compositions of the two samples were. (B) Different colors represent different groups in different environments or conditions. The box diagram represents distributions and dispersions of different groups of samples on the PC1 axis. (C) Bray-Curtis Adonis: Mainly based on the counting statistics of OTUs, comparing the composition differences of the two communities of microorganisms. The actual range of the R-value is between (−1, 1). R > 0 indicates that there is a difference between groups. The closer the R-value is to 1, the greater the difference between groups is than the intragroup difference. The smaller the value of R, there is no significant difference between groups and within groups. The smaller the P-value is, the higher the testability is, and P < 0.05 is statistically significant.

