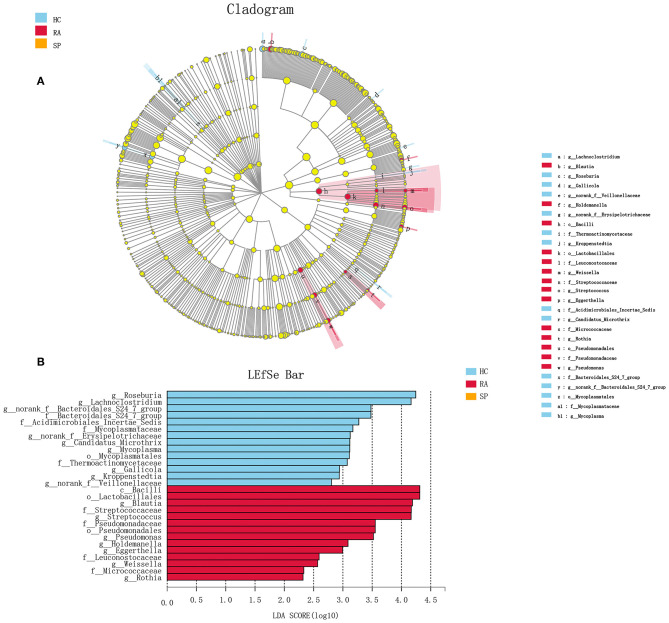
Figure 3.
Discriminant analysis of LEfSe multistage species difference. (A) Cladogram shows phylogenetic distributions of intestinal bacteria in three groups. (B) Indicator bacteria with LDA scores of ≥ 2 in three groups were screened out. Different-colored regions represent different constituents (red, RA; green, HC; blue, SP). Circles indicate phylogenetic levels from domain to genus. Circle diameters are proportional to abundances for each group. It can be seen from the figure that, among the three groups, the abundance peaks of species with significant differences were distributed in RA and HC, respectively, and there was no peak in the SP group.

