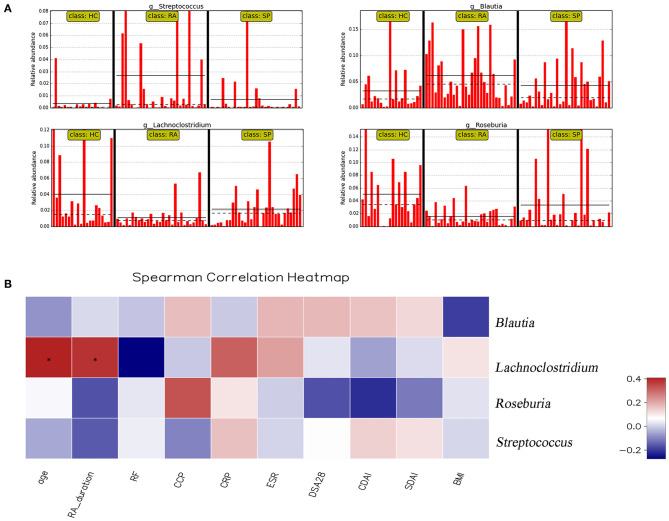
Figure 5.
Correlation analysis between significant genera and clinical parameters. (A) shows the relative abundance of Streptococcus spp., Blautia spp., Lachnoclostridium spp., and Rosebura spp. in individual samples. The ordinate is the relative abundance of bacteria, and the abscissa is the name of each sample. (B) Correlation analyses between relative abundance (%) of specific genera and clinical parameters were performed by using Spearman's correlation analyses. (*) Represents the specific genera whose abundances were significantly correlated with certain clinical parameters. The color of the spots in the right panel represents the R-value of Spearman's correlation between the OTU and genera, and clinical parameters. BMI, body mass index; DAS, disease activity score; CDAI, clinical disease activity index; SDAI, simplified disease activity index; ESR, erythrocyte sedimentation rate; CRP, C-reactive protein; RF, rheumatoid factor; CCP, anti-cyclic citrullinated peptide antibody.

