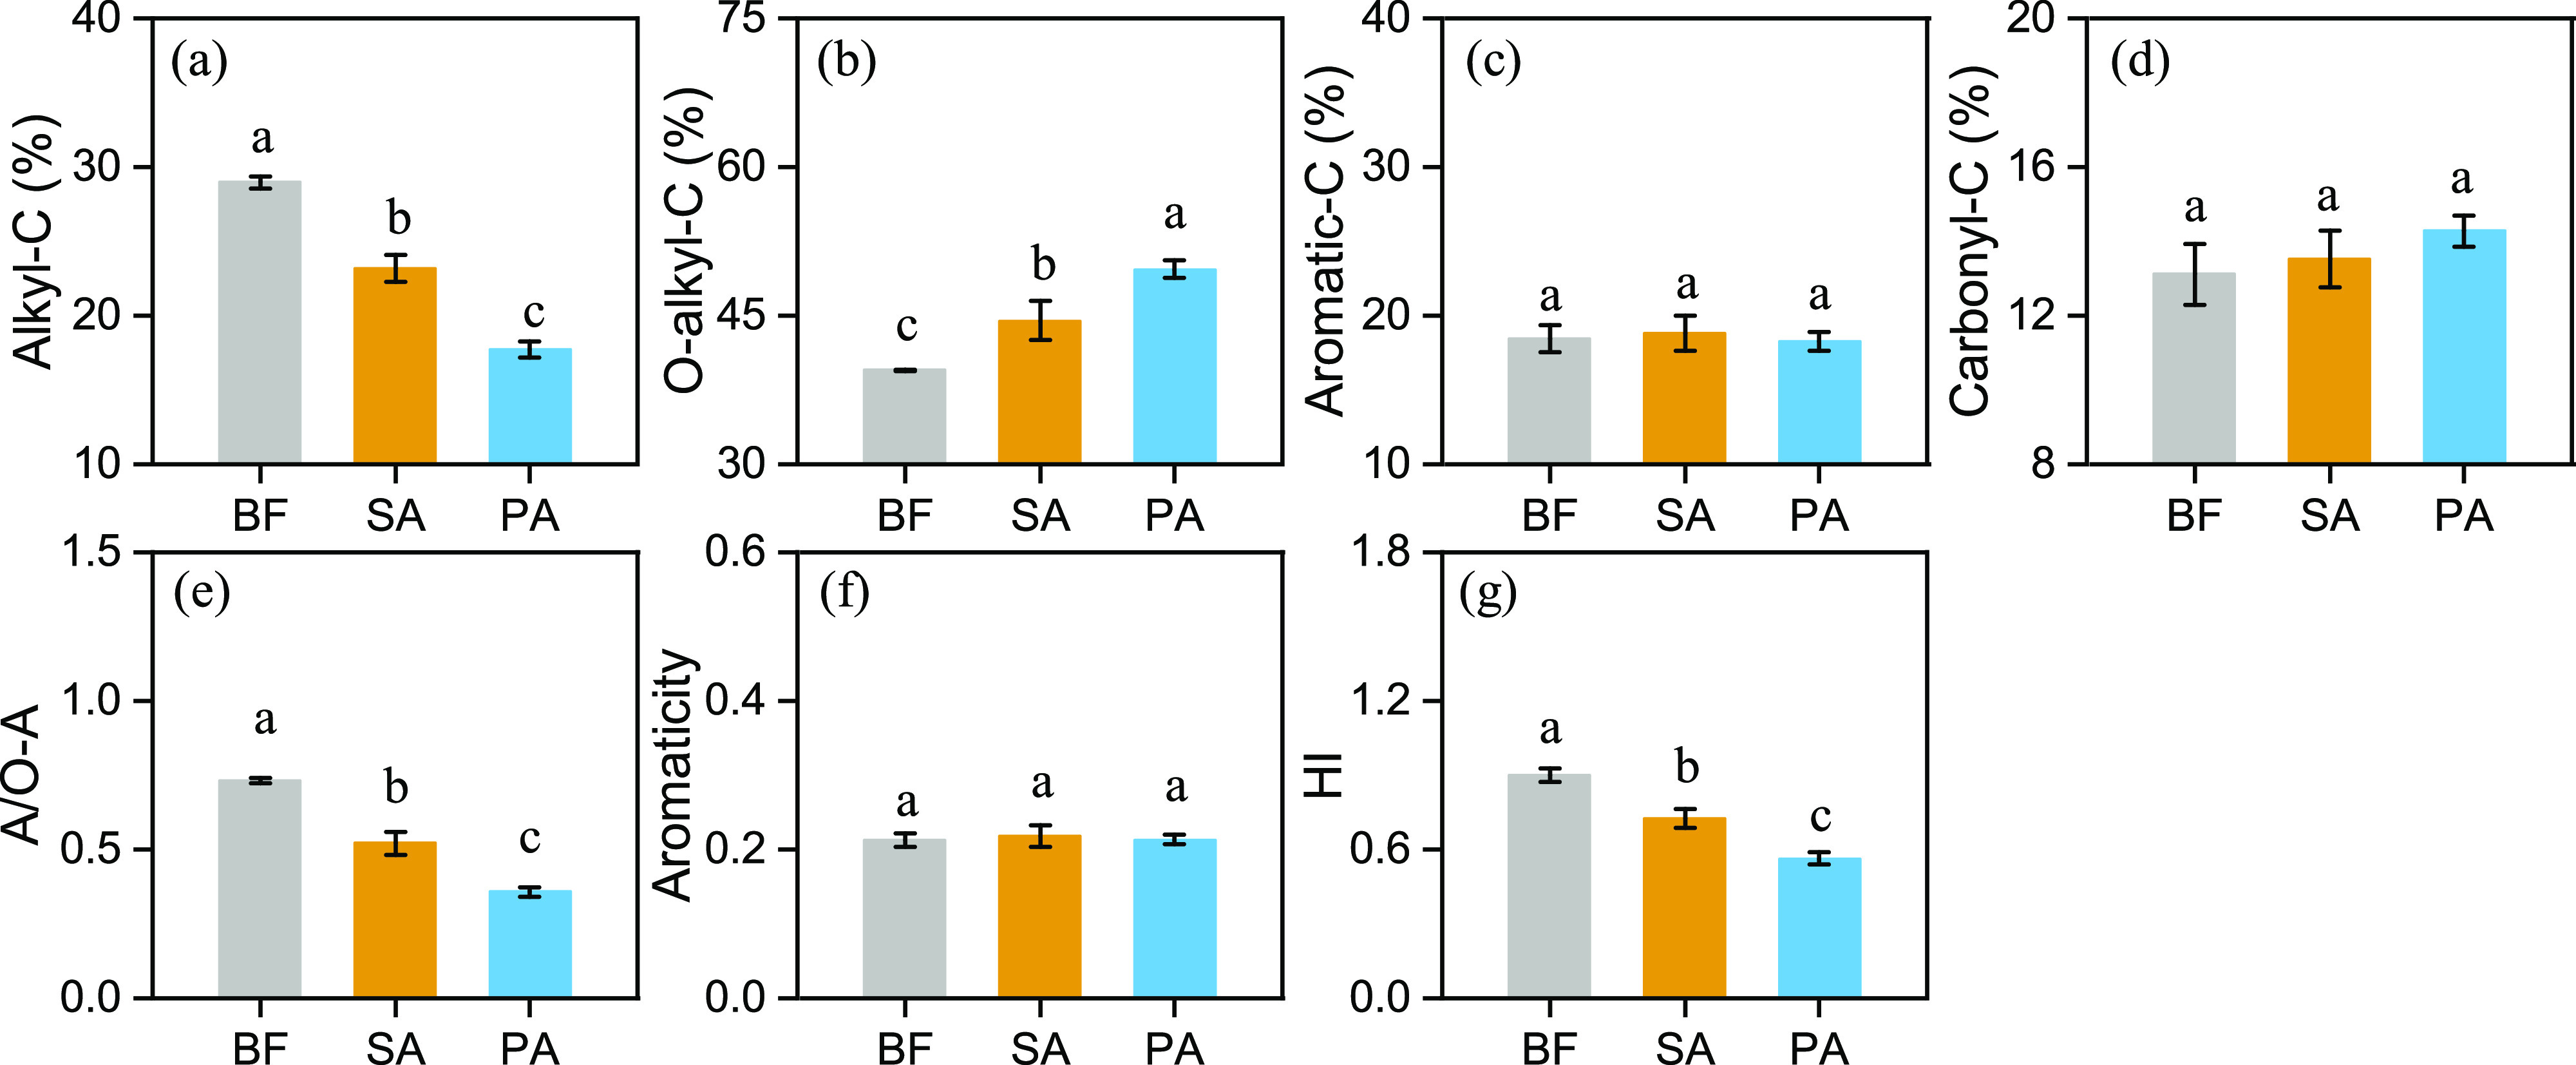
Figure 2.

Relative intensities (%) of eight shift regions of carbon-13 cross-polarization magic angle spinning nuclear magnetic resonance (13C CPMAS NMR) spectra obtained from the wetland soil samples. (a) Alkyl-C; (b) O-alkyl-C; (c) aromatic-C; (d) carbonyl-C; (e) A/O-A; (f) aromaticity; and (g) HI. Soil samples were collected from three areas of wetland: bare flat (BF) land, land invaded by Spartina alterniflora (SA), and land occupied by Phragmites australis (PA). Vertical bars indicate standard deviations of the mean (n = 3). For each parameter, different letters indicate significant differences between means at P < 0.05.
