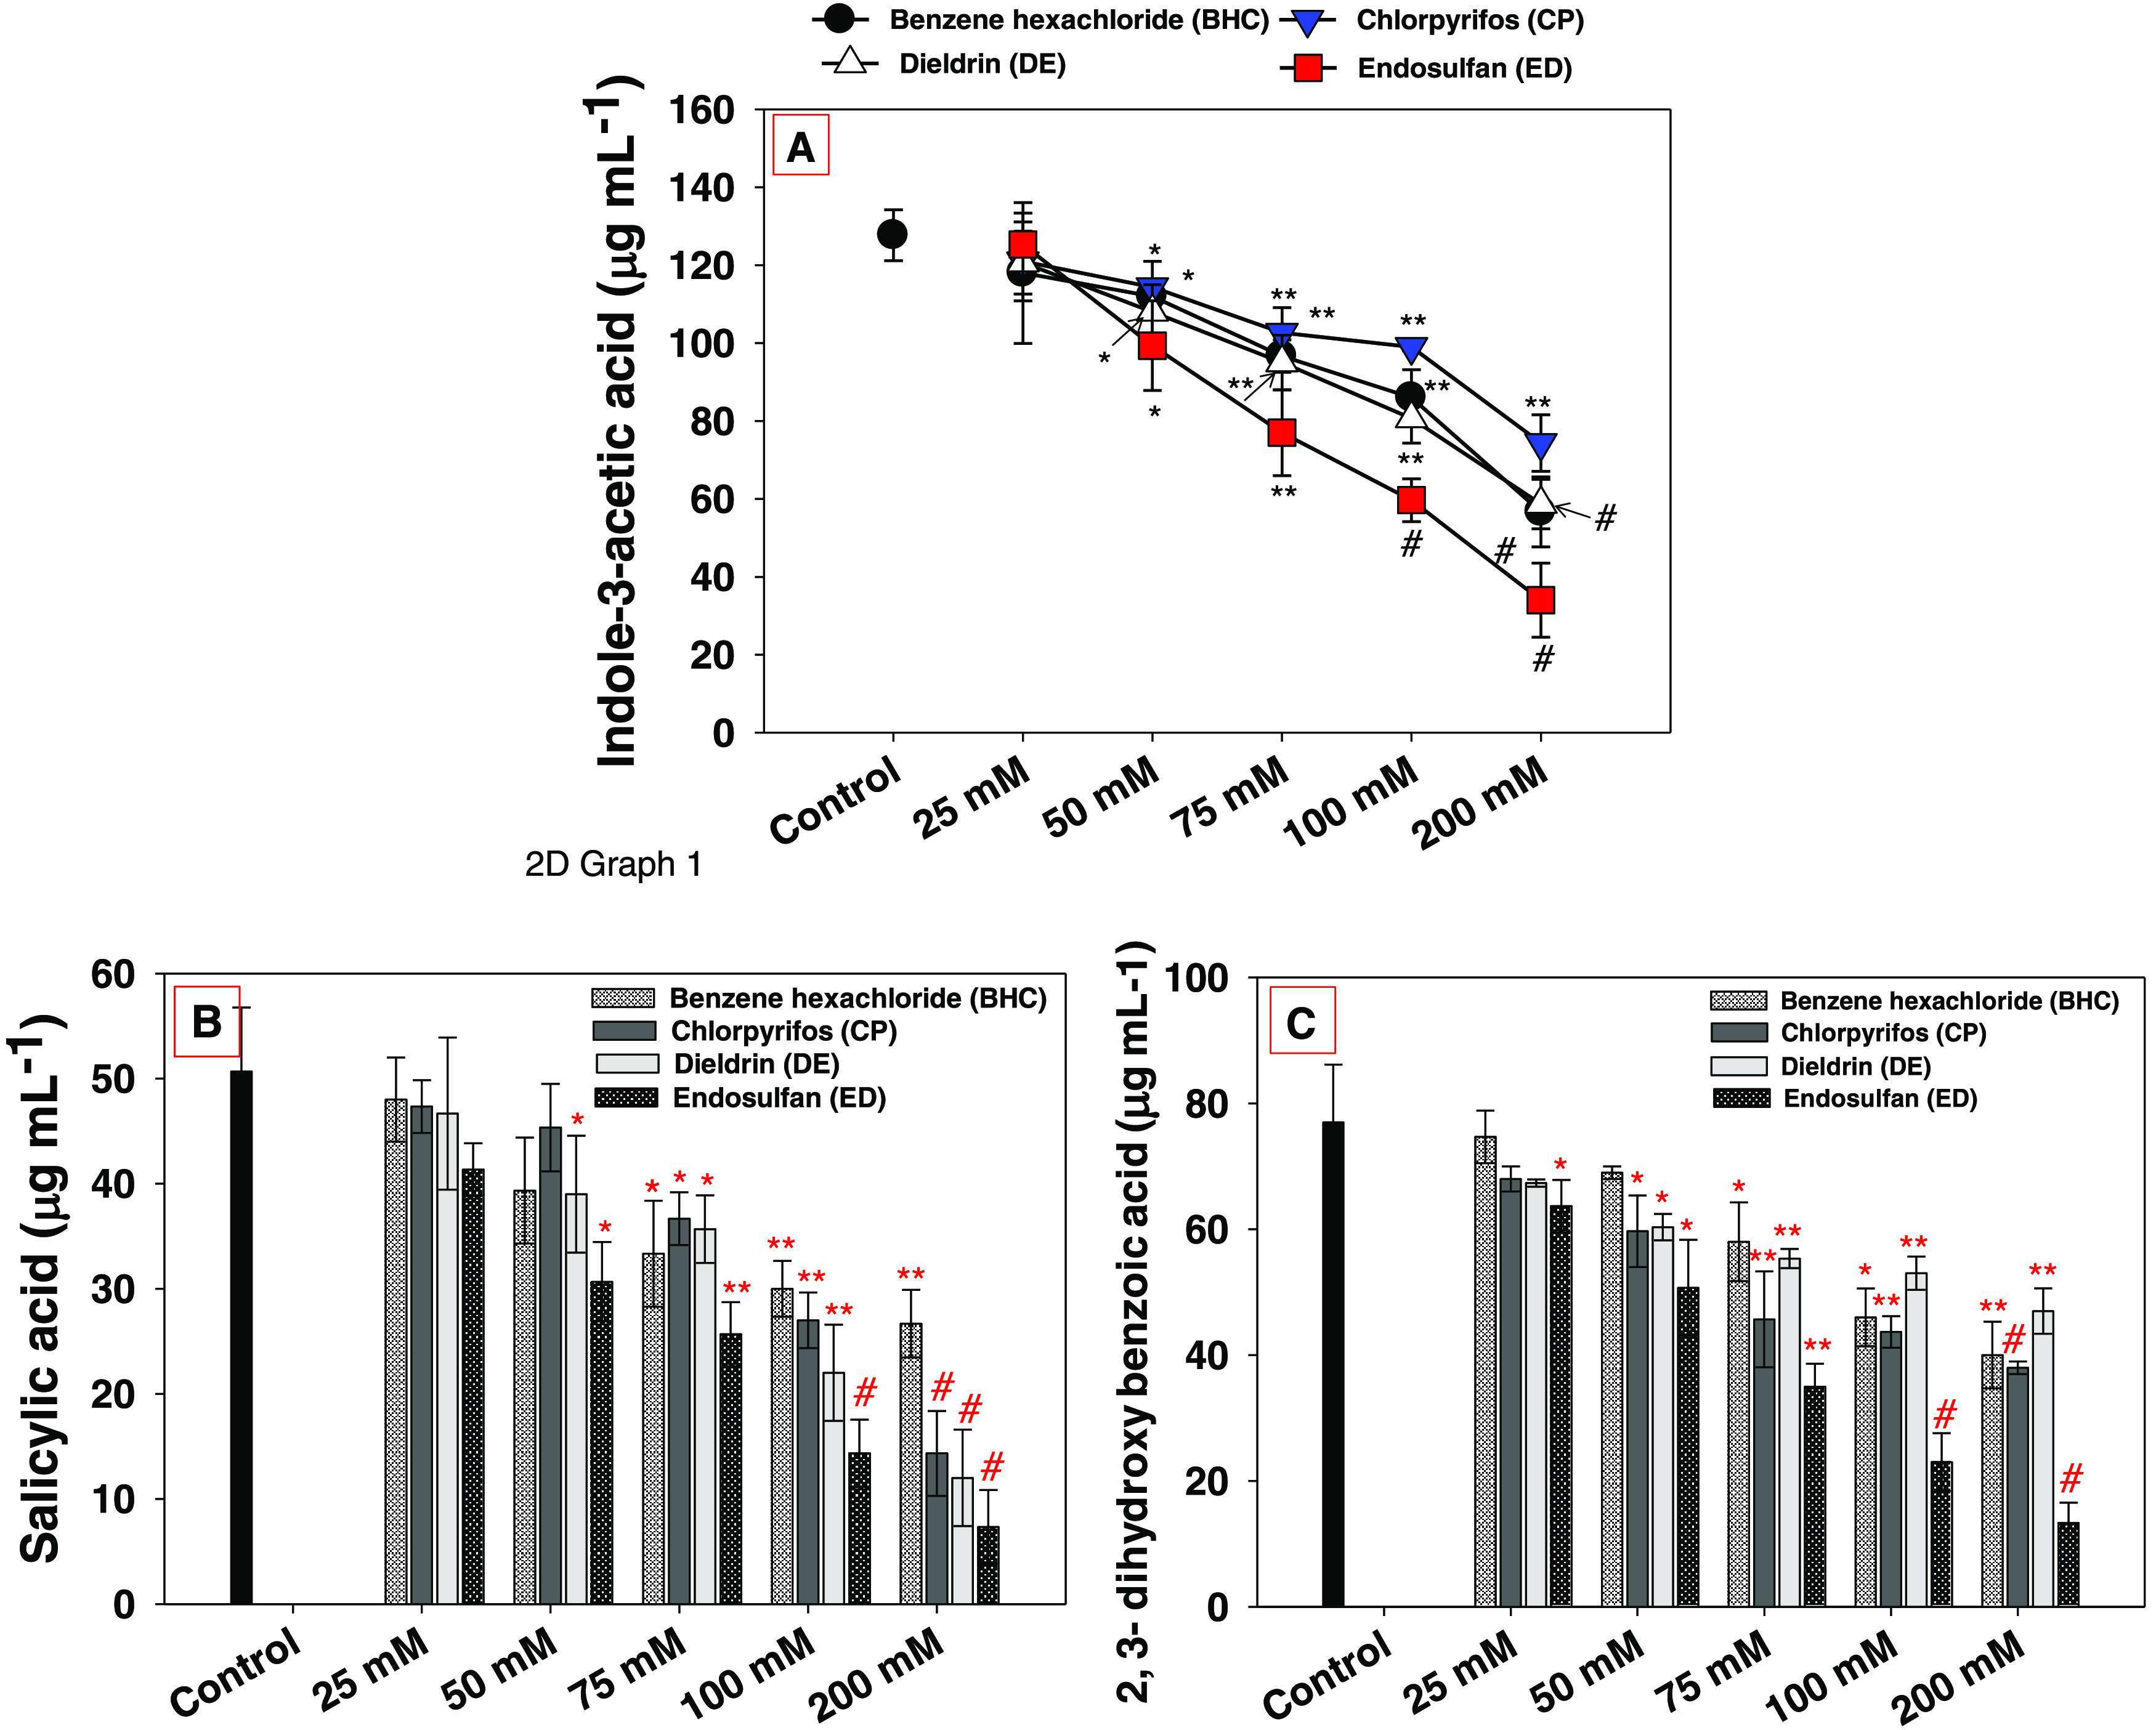
Figure 2.

Effect of varying concentrations of organochlorine pesticides on indole-3-acetic acid (A) and siderophore production: salicylic acid (B) and 2,3-dihydroxybenzoic acid (C) synthesized by E. cloacae strain EAM 35. In this figure, the line diagram and histograms represent the mean values of three replicates (n = 3). Corresponding error bars represent the standard deviation (SD) of three replicates (SD, n = 3). The asterisks *, ** and # denote statistical significance at p < 0.05, p < 0.005, and p < 0.001, respectively, computed by Student’s t-test.
