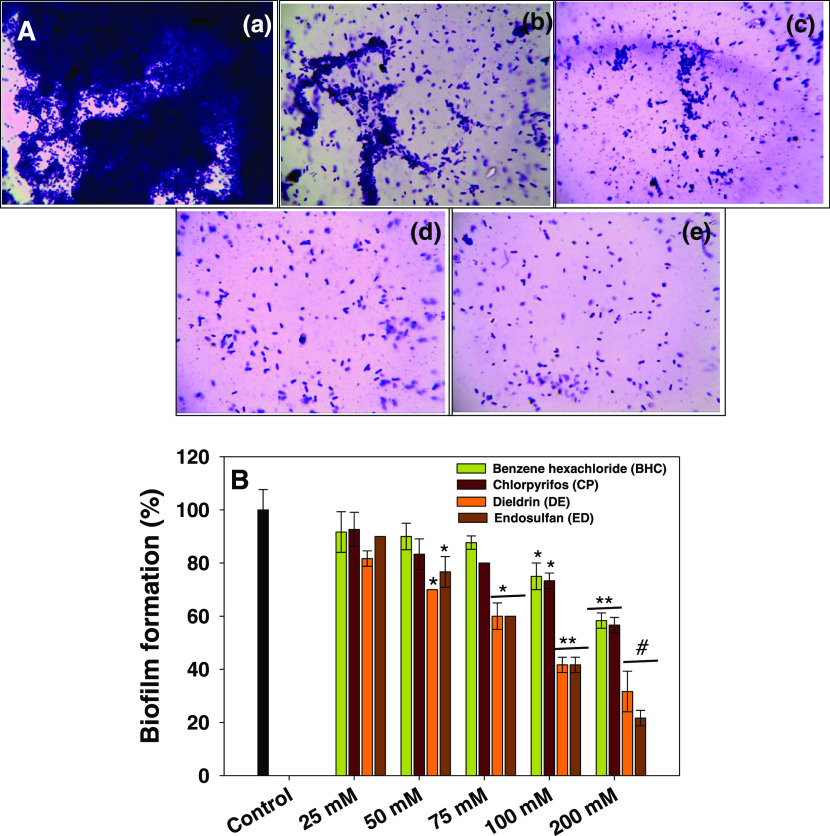
Figure 6.
Impact of different concentrations (25–200 μM) of organochlorine pesticides on biofilm formation (%) by E. cloacae strain EAM 35 after 24 h of incubation. In the figure (A), panel (a) represents the untreated control, whereas panels (b, c, d, and e) depict the biofilm inhibition after the exposure to 200 μM each BHC, CP, DE, and ED, respectively. In figure (B), the histograms represent the mean value of biofilm percentage over the untreated control (100%), while error bars show standard deviation (SD, n = 3) with a significance of *p ≤ 0.05, **p ≤ 0.005, and #p ≤ 0.001.

