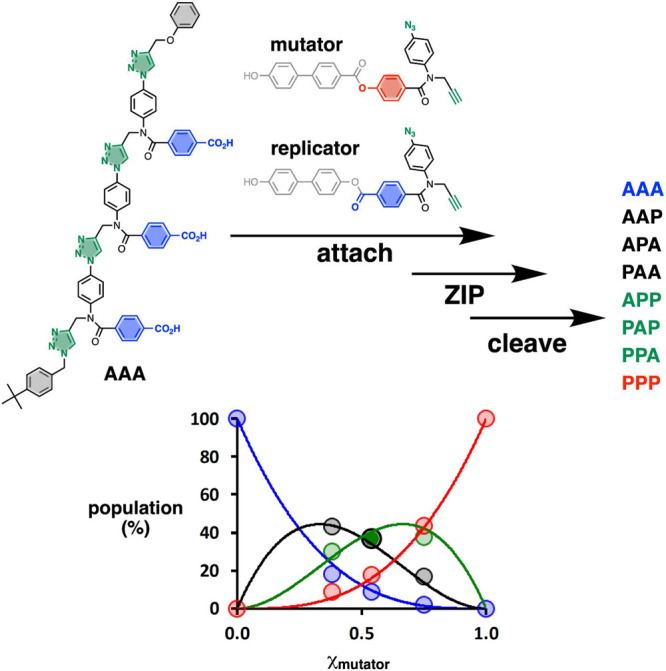
Figure 9.

Product distributions for covalent template-directed replication of an AAA template in the presence of different amounts of a mutator monomer (χmutator). The population of the direct copy AAA is shown in blue, products with a single phenol mutation are shown in black, two phenol mutations are shown in green, and the fully mutated reciprocal copy PPP is shown in red. Calculated statistical distributions are shown as lines, and the experimental results are shown as dots.39
