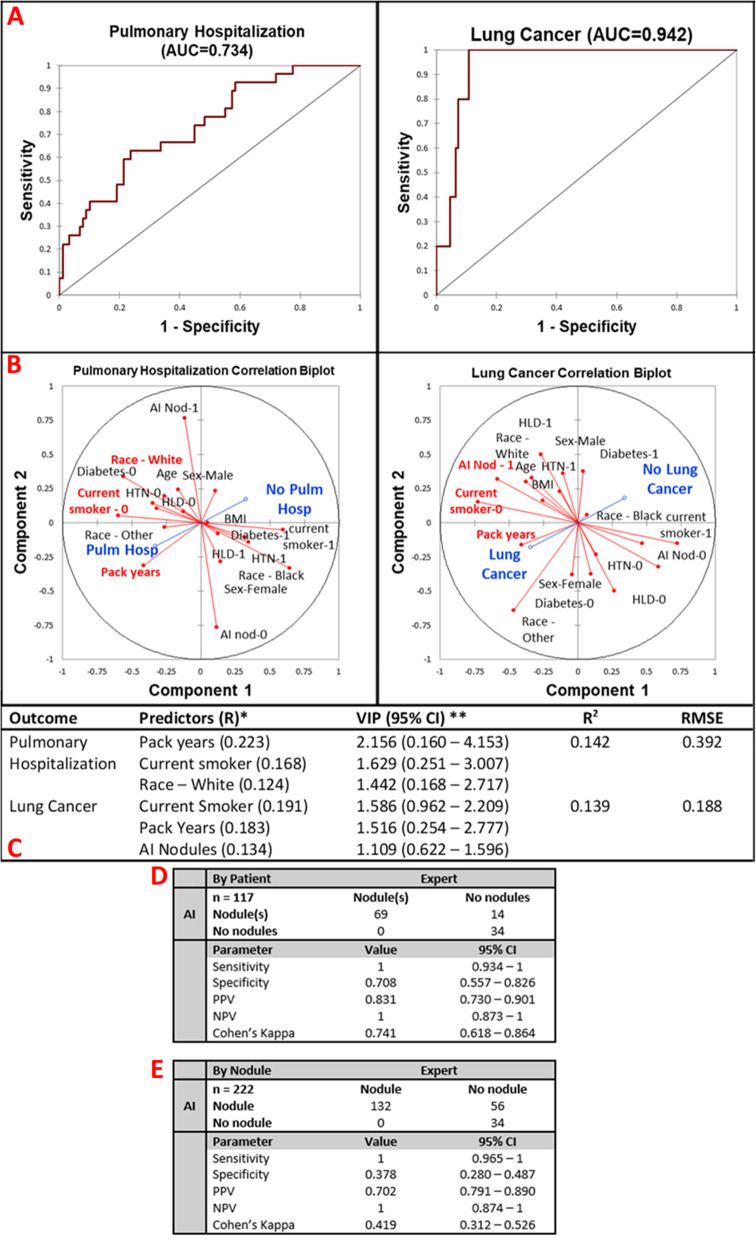
Fig. 6.
Multivariate pulmonary outcome performance and concordance analysis. AI-detected lung nodules were not a significant predictor of pulmonary hospitalization but were a significant predictor for diagnosis of lung cancer in 1 year of follow-up. a ROC curves of prediction of pulmonary hospitalization (AUC = 0.734) and lung cancer (AUC = 0.942). b Correlation biplots for pulmonary hospitalization and lung cancer evaluating the magnitude and direction of association of each predictor with the outcome. c Model parameters. Pulmonary hospitalization is predicted by pack-years, current smoking status, and White race. R2 = 0.142, RMSE = 0.392. Lung cancer is significantly predicted by current smoking status, pack-years, and presence of AI-predicted nodules. R2 = 0.139, RMSE = 0.188. d By patient AI analysis of nodules is excellently sensitive and adequately specific for the detection of any lung nodule in a patient (sensitivity = 1, specificity = 0.708). Both AI and expert have a high concordance of diagnosis of lung nodules in a patient (Cohen’s kappa = 0.741). e The by-nodule analysis was also highly specific and poorly sensitive with an overall moderate agreement between the expert and AI software (sensitivity = 1, specificity = 0.378, Cohen’s kappa = 0.419). AUC, area under the curve; BMI, body mass index; HTN, hypertension; HLD, hyperlipidemia; VIP, variable importance predictor; RMSE, root mean squared error; CI, confidence interval; PPV, positive predictive value; NPV, negative predictive value

