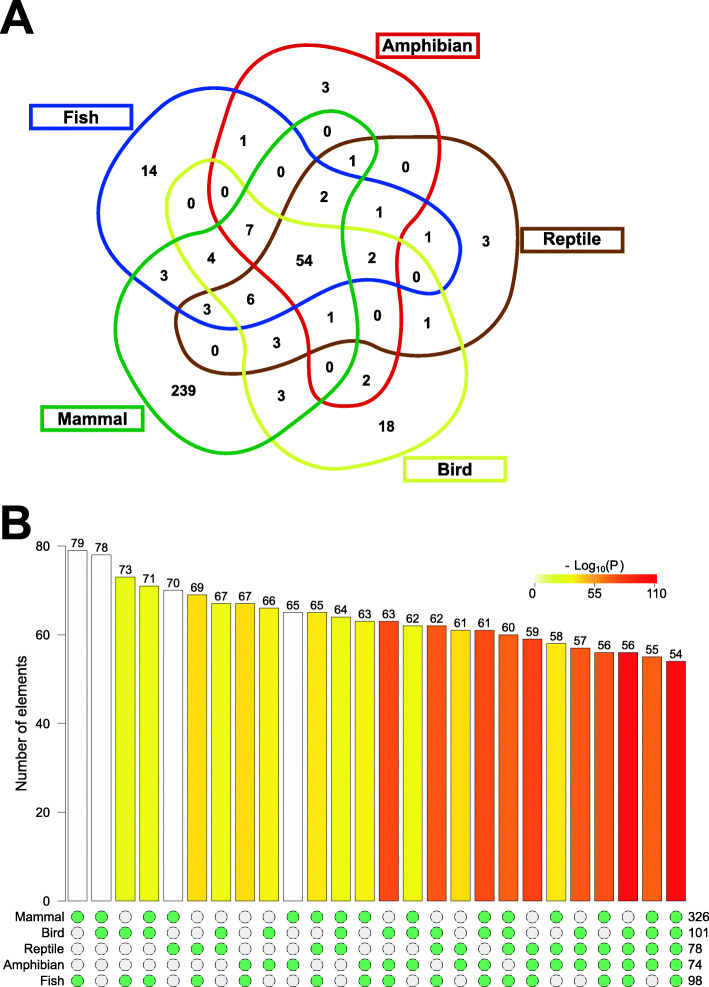
Fig. 2.
Intersections of vertebrate heart miRNA expression profile. (a) Venn diagram showing the intersections of vertebrate heart miRNA families. (b) Fisher’s exact test results for all intersections (p < 0.005 were considered statistically significant). The numbers at the right bottom indicate the number of miRNA families in the groups indicated at the left bottom. The numbers at the top of the bars indicate the number of miRNA families intersecting between the groups included for the statistical tests as stated by the green points at the bottom

