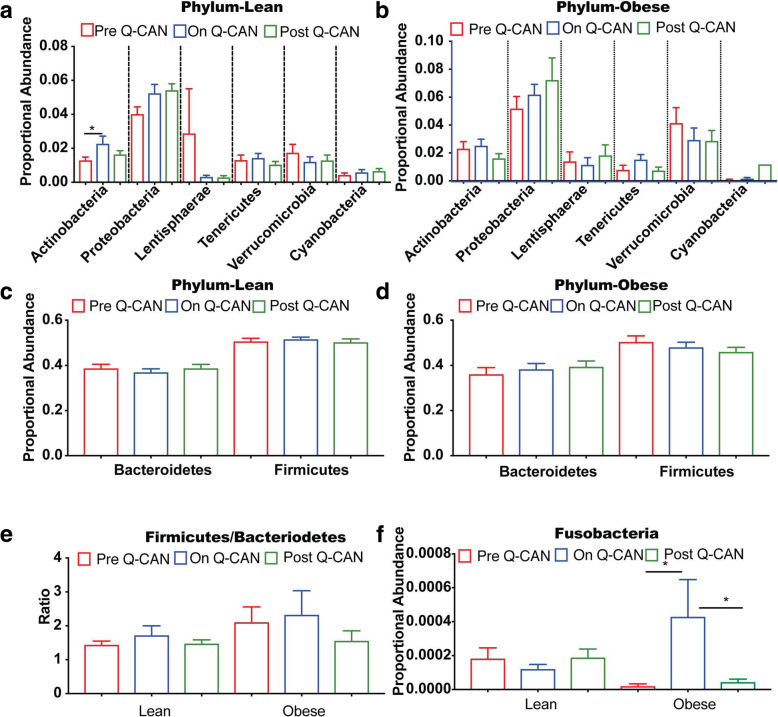
Fig. 2.
Intestinal microbiome analysis at the level of Phylum. a-f Bacteria at Phylum level in both lean and obese shows that only Actinobacteria and Fusobacteria are altered upon Q-CAN® consumption. e The ratio of Firmicutes/Bacteroidetes has a trend for increase in obese compared to lean ones. The results are the average of 3 visits in pre Q-CAN® group, 4 visits in on Q-CAN® group and 4 visits in post Q-CAN® group for each participant. Obese (n = 9 participants), Lean (n = 10 participants). The data are presented as median with SEM, *p < 0.05

