
FIGURE 8.
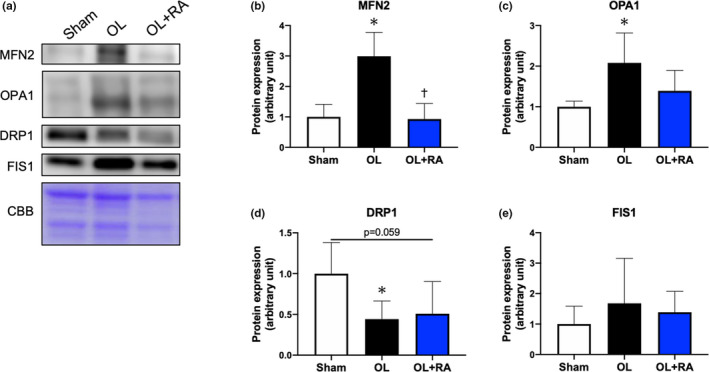
Effects of functional overload and rapamycin administration on the mitochondrial dynamics proteins in the plantaris muscle. Representative immunoblots are shown in (a). Protein expressions of MFN2 (b), OPA1 (c), DRP1 (d), and FIS1 (e) in the plantaris muscle after 14 days of functional overload and rapamycin administration were analyzed by Western blotting. Sham, sham operation; OL, functional overload; OL+RA, functional overload combined with rapamycin administration. Data are presented as means +SD. *p < 0.05 versus the Sham group, † p < 0.05 versus the OL group