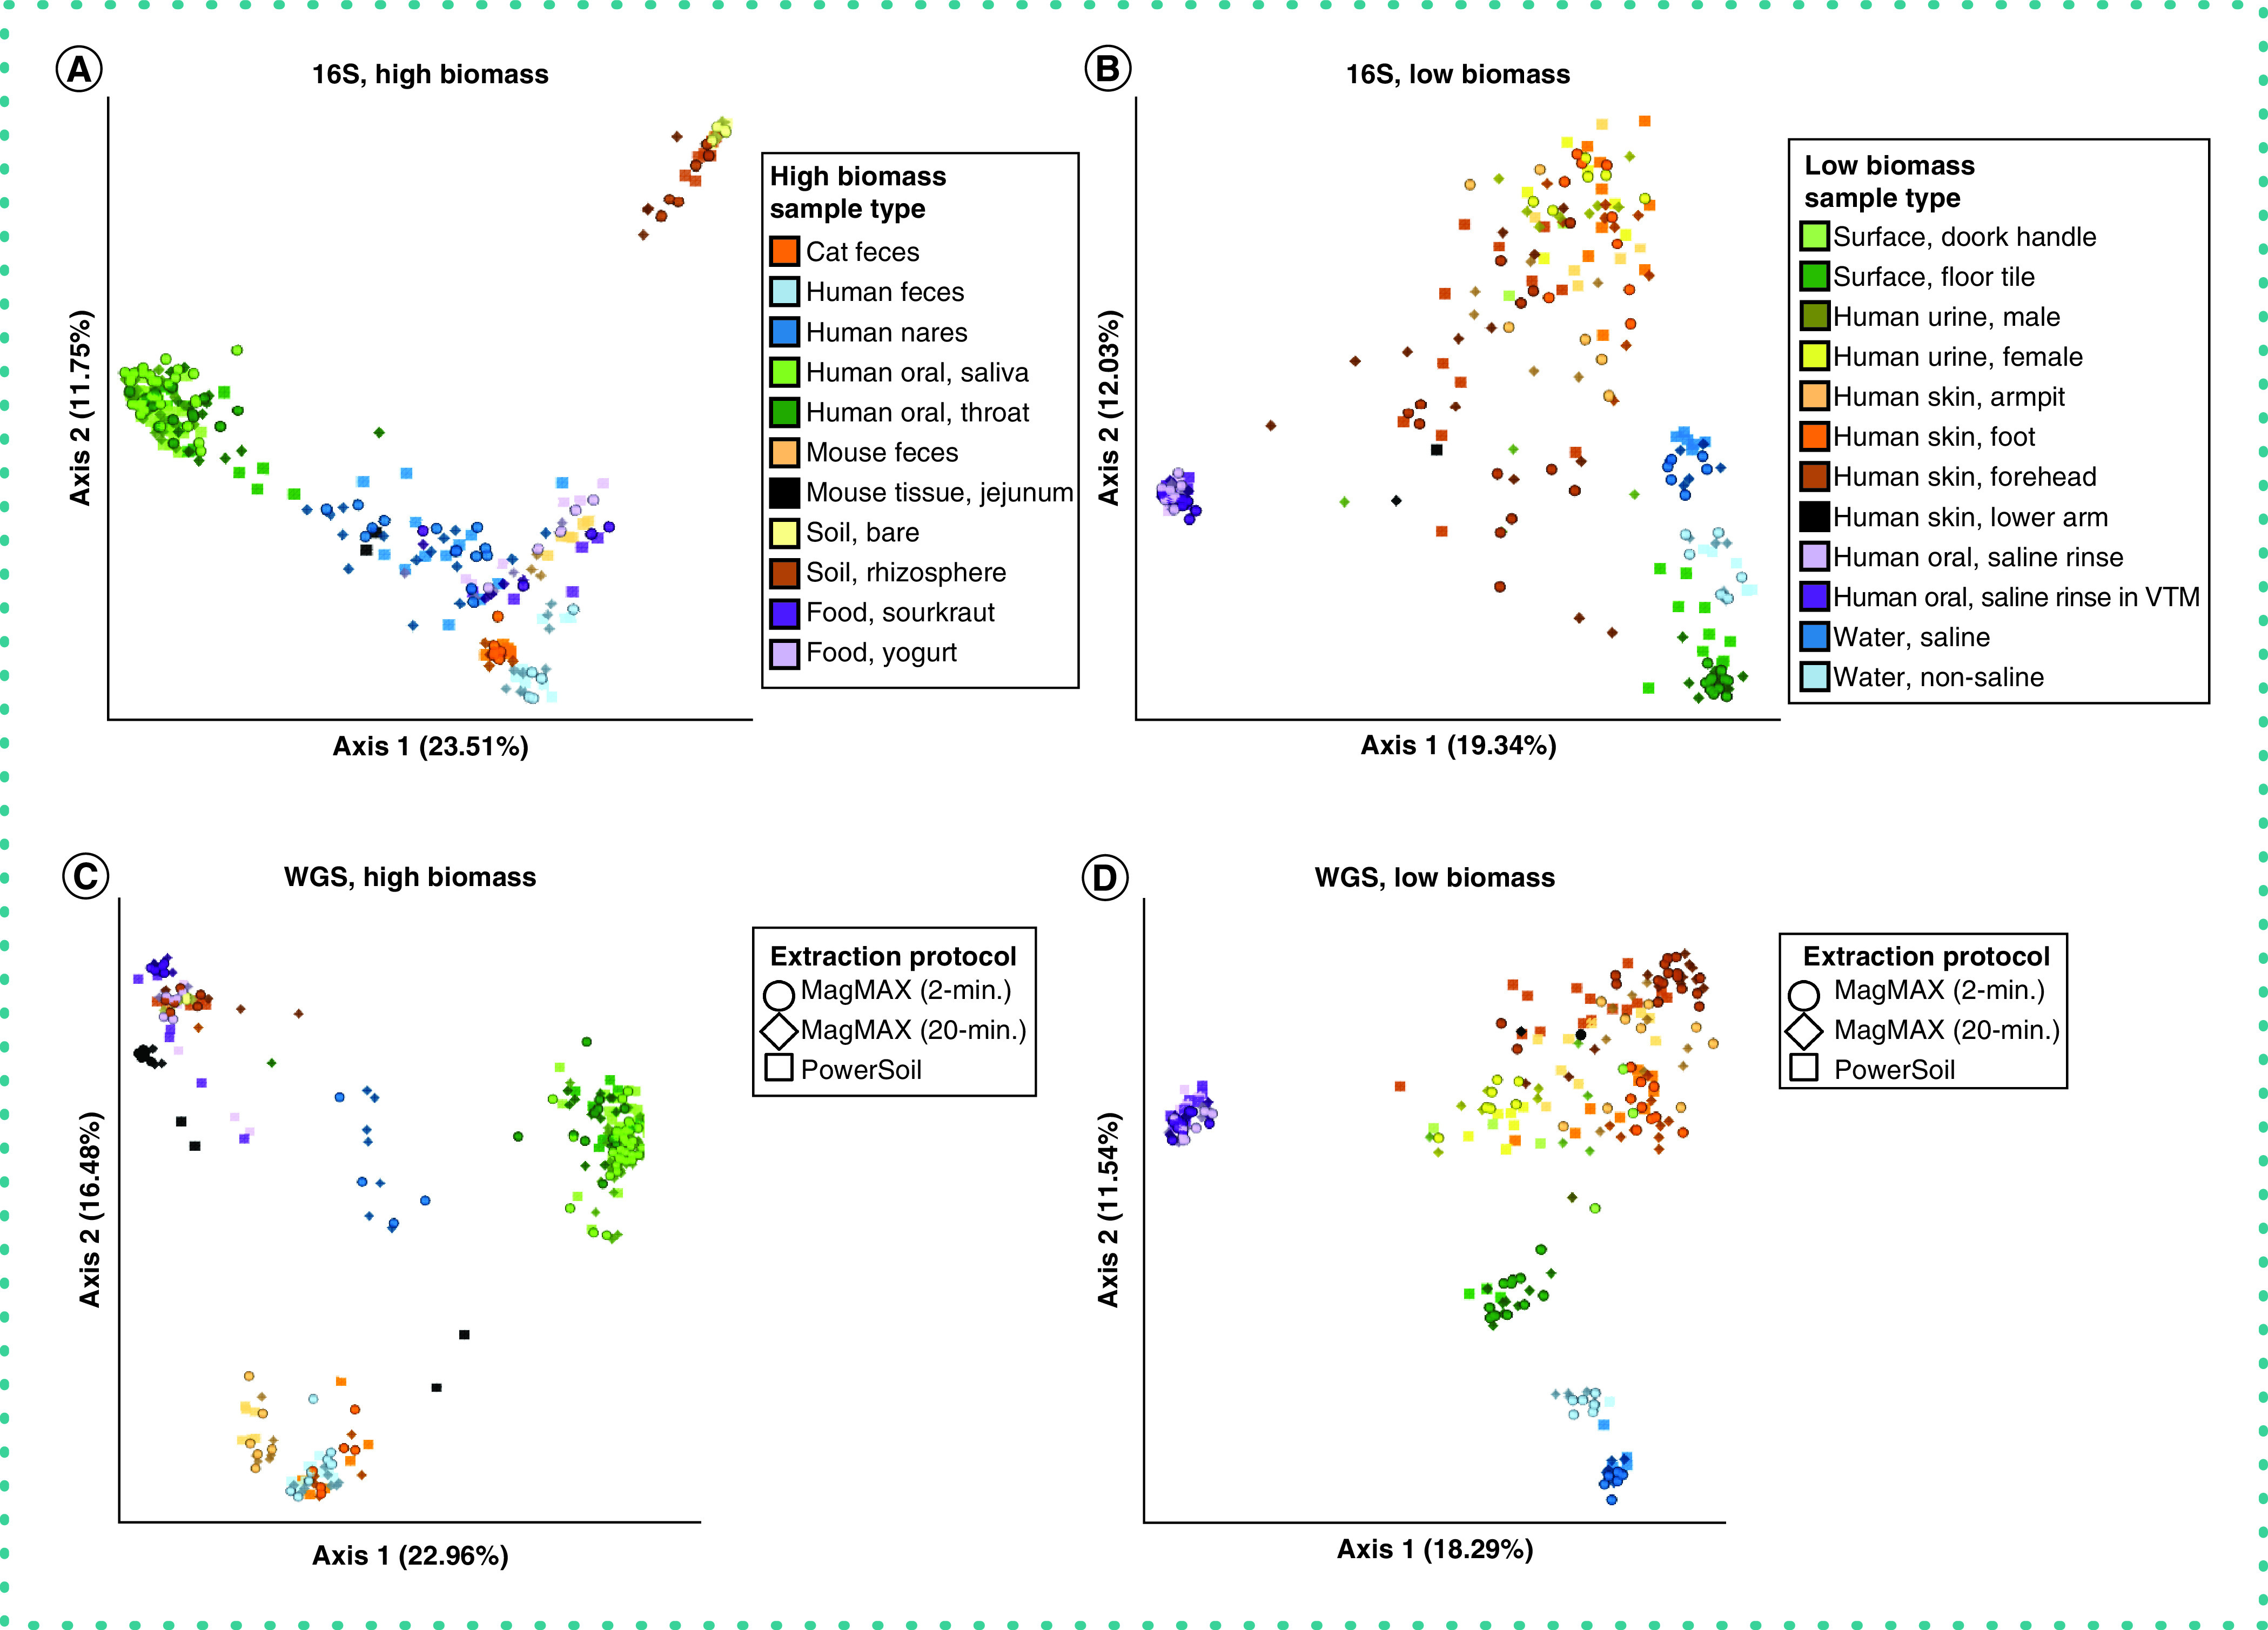
Figure 3. . Beta-diversity among extraction protocols and sample types.

Principal coordinates analysis (PCoA) plots showing unweighted UniFrac distances based on 16S data for (A) high biomass samples and (B) low biomass samples, and shotgun metagenomics data for (C) high biomass samples and (D) low biomass samples. Colors indicate sample types and shapes indicate extraction protocols. Mock community and control blanks were excluded for clarity. 16S data were rarefied to 5,000 quality-filtered reads per sample for both high- and low-biomass samples (n = 611 samples). Metagenomics data were rarefied to 35,000 host- and quality-filtered reads per high-biomass sample (n = 287 samples), and to 20,000 reads per low-biomass sample (n = 242 samples). When using RPCA distances rather than using rarefied data, we excluded samples with fewer reads than the rarefaction depth for that dataset. Rarefaction depths were selected to maintain at least 75% samples from both high- and low-biomass datasets.
