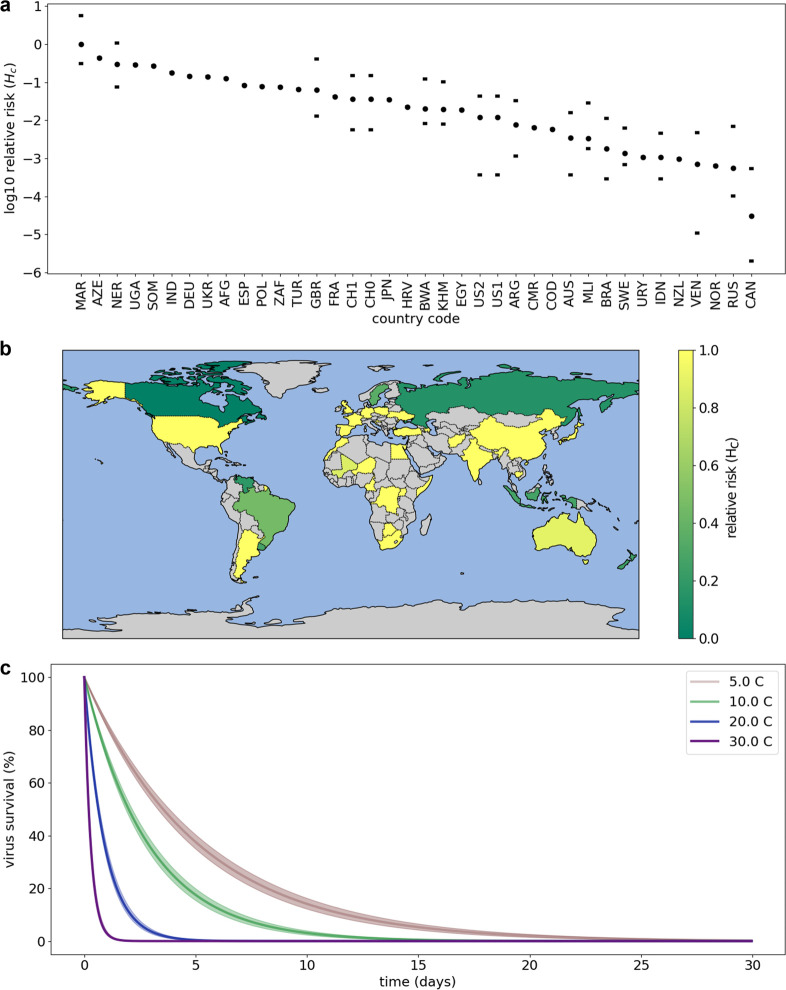
Figure 1.
Virus survivability within freshwater and normalized country comparable risk of transmission (termed relative risk, Hc) associated with sewage spills after dilution by domestic water usage and river flow (results for 39 countries) . (a) Log10 relative risk (Hc) covering the range of 0.001–1.0. Circles are median values, and horizontal lines show the 25th and 75th percentiles due to dilution factors from ref (21). (b) Countries where relative risk, Hc, has been calculated with relative risk as a linear scale. Gray signifies a country not included. (c) Modeled temperature survivability. The root-mean-square difference (RMSD) for each curve is given by the shaded areas.

