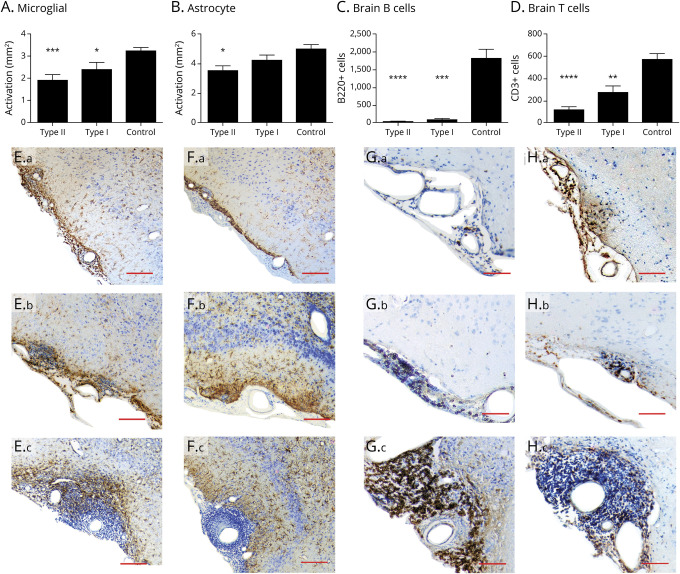
Figure 4. Anti-CD20 Therapy Reduces the Number of Lymphocytes and Glial Activation in DTH-TLS Lesions.
DTH-TLS lesions were established in huCD20 mice. Forty days after lesion induction, the mice were treated with either type I anti-CD20, type II anti-CD20, or a vehicle control for 15 days. (A) Immunohistochemistry showed a reduction in the area of microglial activation after both anti-CD20 treatments. (B) Only type II reduced the area of astrocyte activation. (C) Type I and type II both reduced the number of B cells in the brain. (D) Both anti-CD20 antibodies also lowered the number of T cells in the brain. (E) Photomicrographs show activated microglia in the lesions type II–treated animals (a), type I–treated animals (b), and control animals (c). (F) Representative photomicrographs show astrocytes activation in type II–treated animals (a), type I–treated animals (b), and control animals (c). (G) Representative photomicrographs of meningeal B cells in type II– (a), type I– (b), and vehicle-treated mice (c). (H) Representative photomicrographs of meningeal T cells in type II– (a), type I– (b), and vehicle-treated mice (c). Data represent mean ± SEM; *p < 0.05, **p < 0.01, ***p < 0.001, and ****p < 0.0001. Statistics: 1-way ANOVA with Tukey multiple comparisons test, n = 8 for type II, n = 6 for type I, and n = 11 for control. Scale bars represent 100 µm. ANOVA = analysis of variance; TLS = tertiary lymphoid structures.

