Figure 2.
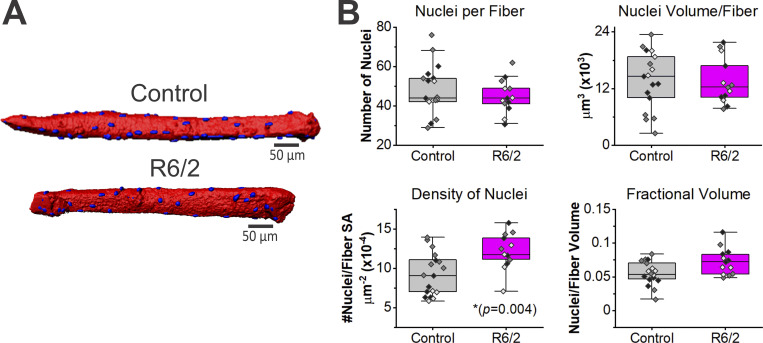
Increased density of nuclei in R6/2 skeletal muscle fibers. (A) 3-D reconstructions of muscle fibers stained with 500 nm Di-8-ANEPPS (red) and DAPI (blue) from confocal image stacks; scale bars, 50 µm. (B) The number of nuclei per fiber (top left) and the total volume that the nuclei occupy per fiber (top right) were not significantly different. The density of nuclei, defined as nuclei per fiber surface area (SA), was significantly increased in R6/2 mice (bottom left). Thus, nuclei occupy more volume within the R6/2 compared with control muscle fibers (bottom right). Data points are color-coded to indicate they are from the same animal. Data were from n = 17 control fibers from three mice and n = 13 R6/2 fibers from three mice.

