Figure 5.
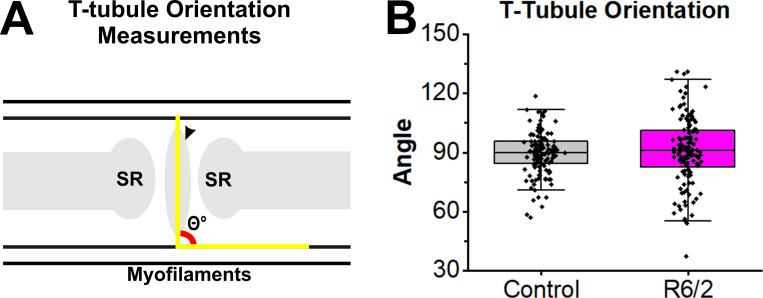
T-tubule orientation in late-stage R6/2 FDB muscle. (A) Illustration showing angle measured to assess the orientation of t-tubule major axis relative to the actin/myosin myofilaments. (B) No significant differences were found in angle means between control (six mice, 13 fibers, and 133 t-tubules) and R6/2 FDB (six mice, 15 fibers, and 128 t-tubules) t-tubules using a linear mixed-effect model (P value = 0.662). However, R6/2 t-tubules had increased variability in orientation.

