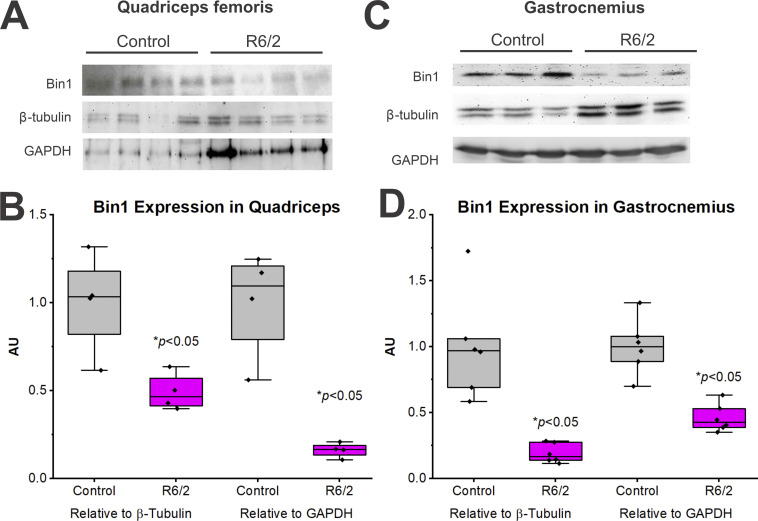
Figure 8.
Bin1 protein levels in muscles of R6/2 and control mice. (A–D) Western blots for Bin1 protein in the quadriceps femoris (A and B) and the gastrocnemius (C and D) of age-matched late-stage (10–13 wk of age) control (WT) and R6/2 mice. (A and C) Representative Western blots for Bin1 as well as β-tubulin and GAPDH for normalization. Equal amounts of protein were loaded per lane (50 µg). (B and D) Bin1 band intensities normalized to β-tubulin and GAPDH levels (relative to control) for the quadriceps femoris (B) and gastrocnemius (D). For A and B (quadriceps femoris), n = 4/group. For C and D (gastrocnemius), n = 6/group. *, Significantly different from control at P < 0.05. AU, arbitrary units.

