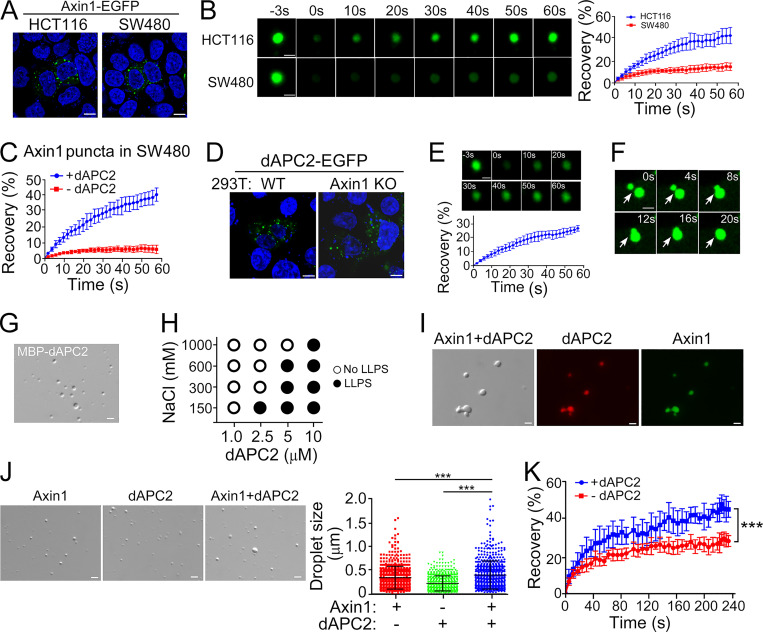
Figure 2.
APC undergoes LLPS and promotes Axin1 condensate formation. (A and B) Confocal images (A) and FRAP analysis (B) of Axin1 puncta in HCT116 and SW480 cells. (C) FRAP analysis of Axin1 puncta in SW480 cells coexpressing dAPC2. (D) dAPC2-EGFP puncta Rel.in WT and Axin1 KO HEK293T cells. (E and F) FRAP analysis (E) and confocal images showing fusion (F) of dAPC2-EGFP puncta in Axin1 KO HEK293T cells. (G) dAPC2 protein droplets with 10% PEG8000. (H) dAPC2 droplet formation with 3.5% PEG8000. (I) Overlapping of Axin1 (green) and dAPC2 (red) in droplets. (J) Axin1 droplets with or without dAPC2. Data are shown as mean ± SD of droplets in six fields (220 × 166 mm) for each condition. (K) FRAP analysis of Axin1 droplets with or without dAPC2. Data are shown as mean ± SD (n = 3). Scale bars in A and D, 10 µm; in B, E–G, I, and J, 2 µm. ***, P < 0.001.

