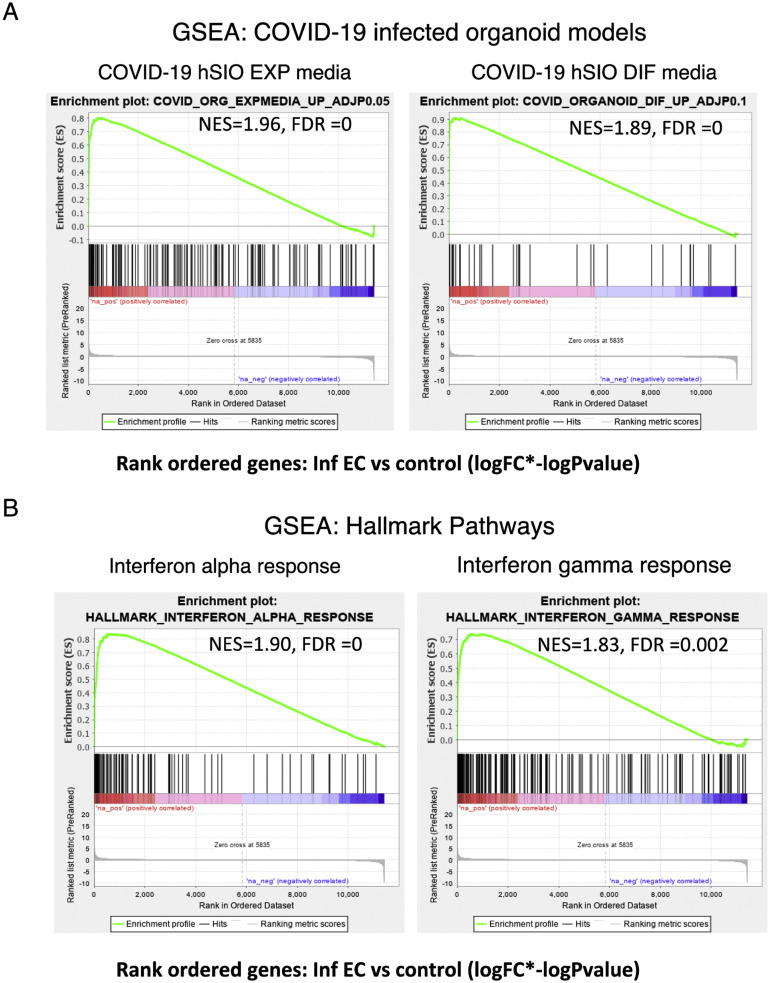
Supplementary Figure 12.
Immune signatures in the EC of patients with COVID-19. GSEA was performed using a rank-ordered list of genes differentially expressed in the infected EC vs control EC. The metric for ranking was log(FC) × –log(P value). (A) GSEA was performed on the rank-ordered EC gene set using SARS-CoV-2–infected organoid data sets. The gene sets tested were molecular signatures curated from SARS-CoV-2–infected organoid experimental data sets using hSIOs grown in either (1) Wnt high expansion (EXP) medium (at adjP < .05) or (2) differentiation (DIF) medium (at adjP < .1). Only gene sets significantly enriched (at FDR of <0.05) are displayed. (B) GSEA was performed for the same rank-ordered EC gene set using the Hallmark pathway data sets. Two significantly enriched pathways were found to be associated with up-regulated genes in infected EC relative to control individuals (at FDR of <0.05). Normalized enrichment score (NES) and FDR values are as indicated.

