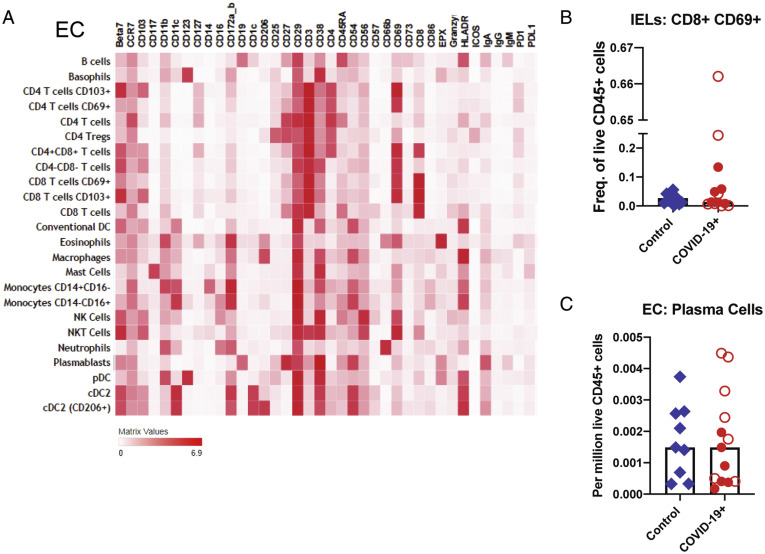
Supplementary Figure 7.
Altered immune populations in the EC of patients with COVID-19 compared to control individuals. (A) The heatmap shows the clustering and distribution of different cell types in the EC. Relative frequencies of (B) IELs and (C) plasma cells in the EC of control individuals and patients with COVID-19. Open red circles denote patients with asymptomatic/mild/moderate disease, and filled red circles denote patients with severe COVID-19. The bar plots show median frequencies. NK, natural killer; NKT, natural killer T.

