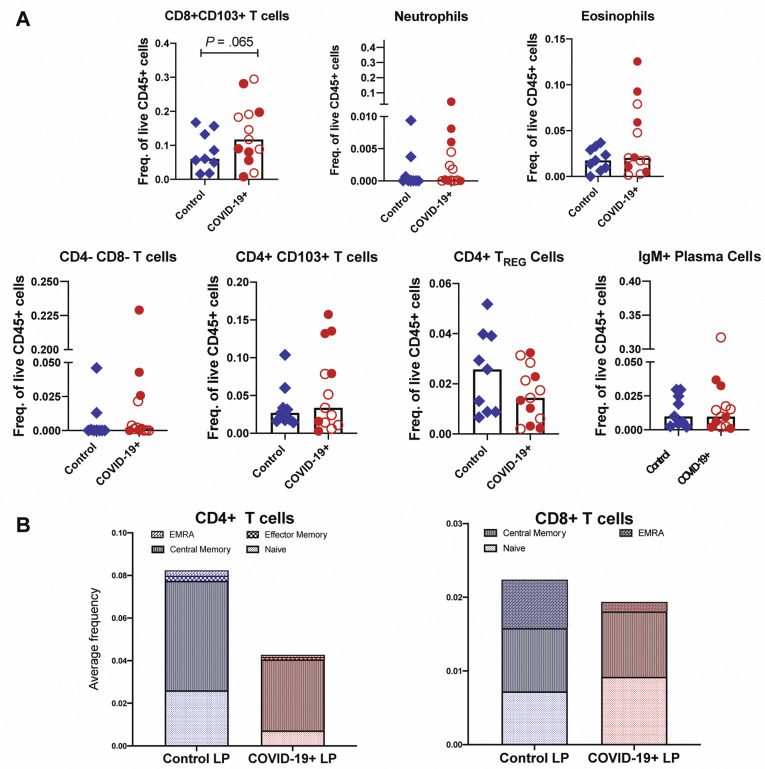
Supplementary Figure 9.
Altered immune populations in the LP of patients with COVID-19 compared to control individuals. (A) Relative frequencies of LP immune cells in control individuals and patients with COVID-19. Open red circles denote patients with asymptomatic/mild/moderate disease, and filled red circles denote patients with severe COVID-19. The bar plots show median frequencies. (B) The stacked bar graphs show the distribution of average frequencies of naive and memory CD4+ and CD8+ T cells in the LP of patients with COVID-19 and control individuals. EMRA, effector memory T cells that re-express CD45RA; Freq., frequency; TREG, T regulatory.

