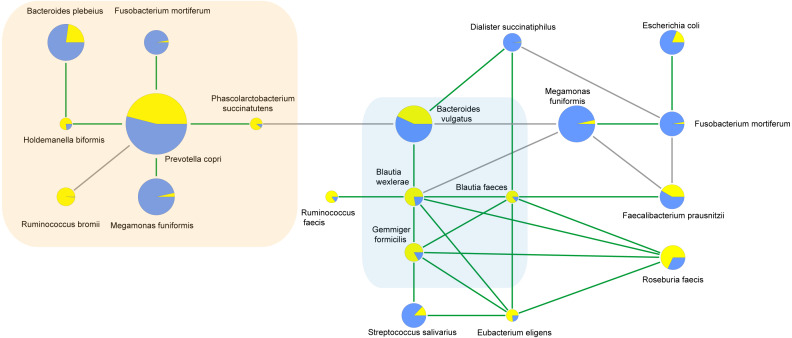
Figure 6. Correlations between species calculated using Spearman correlation algorithm.
The light yellow part is the correlation species of ASD microbiota, and the light blue part is the shared correlation species by ASD and obesity microbiota, while the other part was the correlation species of obesity microbiota. The pie charts show relative species proportions in ASD (yellow) and obesity groups (blue), and the circle size represents the read number. Line color: Green (positive relationship) and grey (negative relationship).

