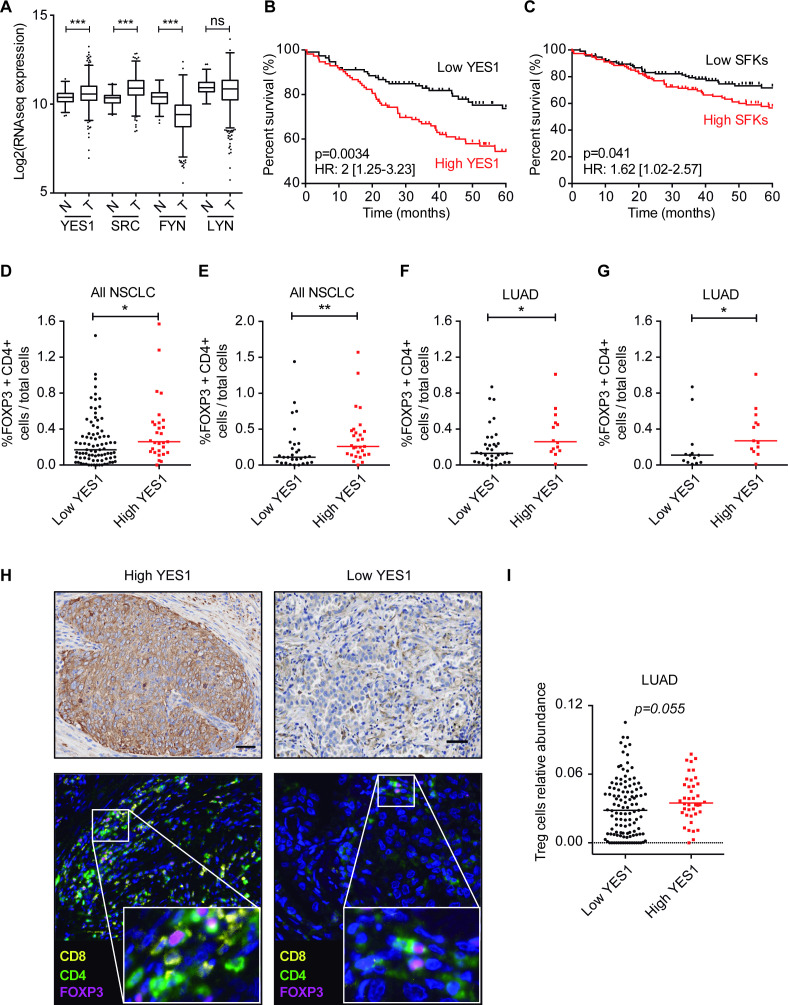
Figure 1.
(A) Comparison of YES1, SRC, FYN and LYN mRNA expressions between non-malignant lung tissue and NSCLC (TCGA cohort). Mann-Whitney U test was used for the statistical analysis. (B, C) Kaplan-Meier survival curves showing that high YES1 and SFK levels (above the median) are associated with worse OS in NSCLC. The log-rank test was used for the statistical comparisons. (D, E) Quantification of FOXP3+CD4+ cells in NSCLC specimens from the CUN cohort. The percentage of Tregs (FOXP3+CD4+) in YES1-positive tumors in the upper quartile of the YES1 H-score is significantly higher than that found for the rest of the tumors (D) and in the lower quartile (E). (F, G) Quantification of FOXP3+CD4+ cells in patients with LUAD from CUN. The percentage of Treg cells in the YES1 upper quartile was compared with the rest of the quartiles (F) or the lower quartile (G). (H) Representative images of YES1 IHC and multiplex immunofluorescence for CD8+, CD4+ and FOXP3+CD4+ cells in patients with NSCLC. (I) Relative abundance of Treg cells in patients with LUAD from the TCGA database analyzed with CIBERSORT tool. Scale bar: 50 µm. (D–G, I) Data are expressed as median, and statistical comparisons were performed using the Mann-Whitney U test. *P<0.05, **P<0.01. CUN, University Clinic of Navarra; IHC, immunohistochemistry; LUAD, lung adenocarcinoma; ns, not significant; NSCLC, non-small cell lung cancer; OS, overall survival; SFK, SRC family kinase; SRC, Treg, regulatory T cell.

