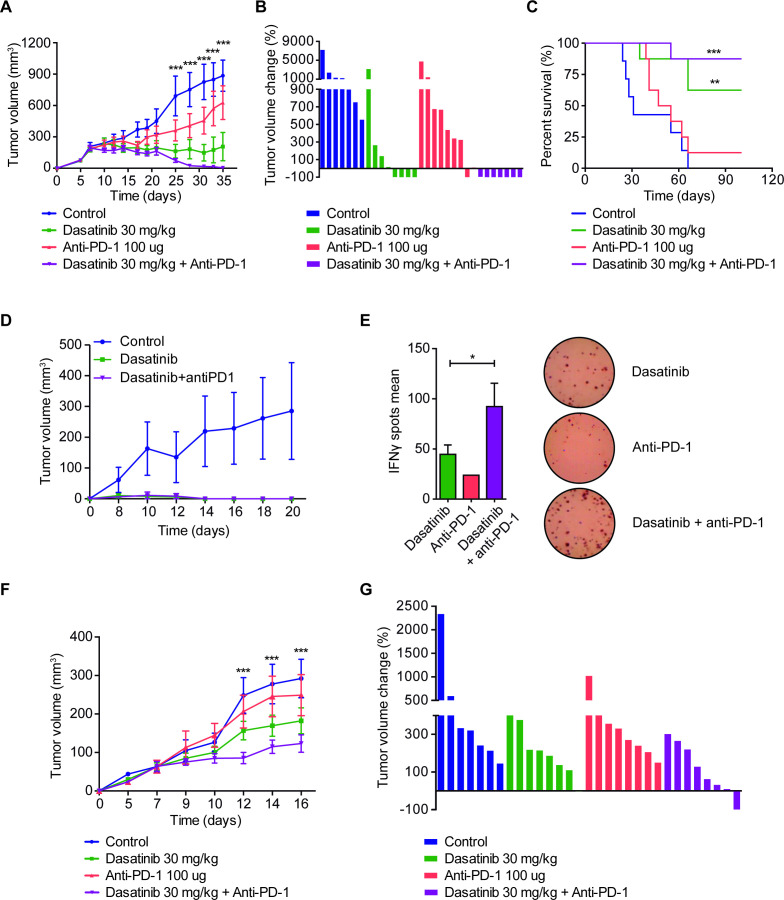
Figure 3.
(A) Subcutaneous tumor volume in the 393P model (Sv/129 mice) treated with dasatinib (30 mg/kg/day), anti-PD-1 (100 µg, days 7, 10 and 13), or both (n=8). Statistical differences are indicated for the comparisons between double-treated and control groups. (B) Waterfall plot showing the individual tumor volume changes between days 7 and 35 in the 393P model. (C) Survival curves of the in vivo experiment shown in (A). Log-rank test was used for statistical analysis. A final volume of 1000 mm3 was used as endpoint criteria. (D) Rechallenge experiment using 393 P cells injected in tumor-rejected mice, 60 days after tumor disappearance. Naïve mice were used as control group (n=6). (E) Analysis of 393P-specific IFN-ɣ secretion by splenocytes isolated from the mice of the rechallenge experiment. IFN-ɣ levels were measured using ELIspot technique. Student’s t-test was used for comparison. (F) Tumor growth of UN680 cells implanted in A/JOlaHsd mice and treated with dasatinib (30 mg/kg, daily), anti-PD-1 (100 µg, days 5, 8 and 11), or both (n=8). (G) Waterfall plot of the volume changes in UN680 tumors between days 5 and 16. (A, F) Data are expressed as mean±SEM and were analyzed with a two-way analysis of variance followed by a post hoc Bonferroni test. Statistical differences show the comparison between controls versus the double-treatment group. *P<0.05, **P<0.01, ***P<0.001. ELIspot, enzyme-linked immunospot; IFN-γ, interferon gamma; PD-1, programmed cell death 1.

