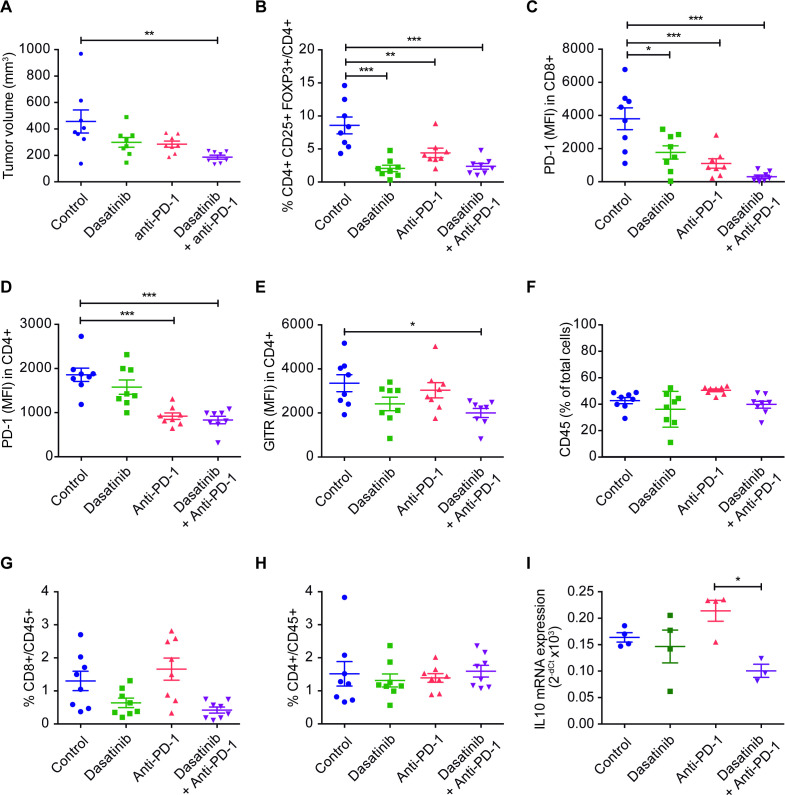
Figure 4.
(A) Tumor volumes of 393 P cells, at the moment of conducting the flow cytometry assay (day 14). Mice were treated with dasatinib (30 mg/kg/day), anti-PD-1 (100 µg, days 4, 7 and 10), or both (n=8). (B–H) Percentage of cells or MFI of tumor immune populations: tumor-infiltrating Treg (FOXP3+CD25+CD4+) (B), PD-1 in CD8+ (C), PD-1 in CD4+ (D), GITR in CD4+ (E), CD45+ (F), CD8+/CD45+ (G) and CD4+/CD45+ (H) cells. (I) mRNA expression of IL-10 in 393P tumors. Data are represented as mean±SEM. Comparisons were analysed using a one-way analysis of variance followed by a posthoc Bonferroni test. *P<0.05, **P<0.01, ***P<0.001. IL, interleukin; MFI, median fluorescence intensity; PD-1, programmed cell death 1; Treg, regulatory T cell.

