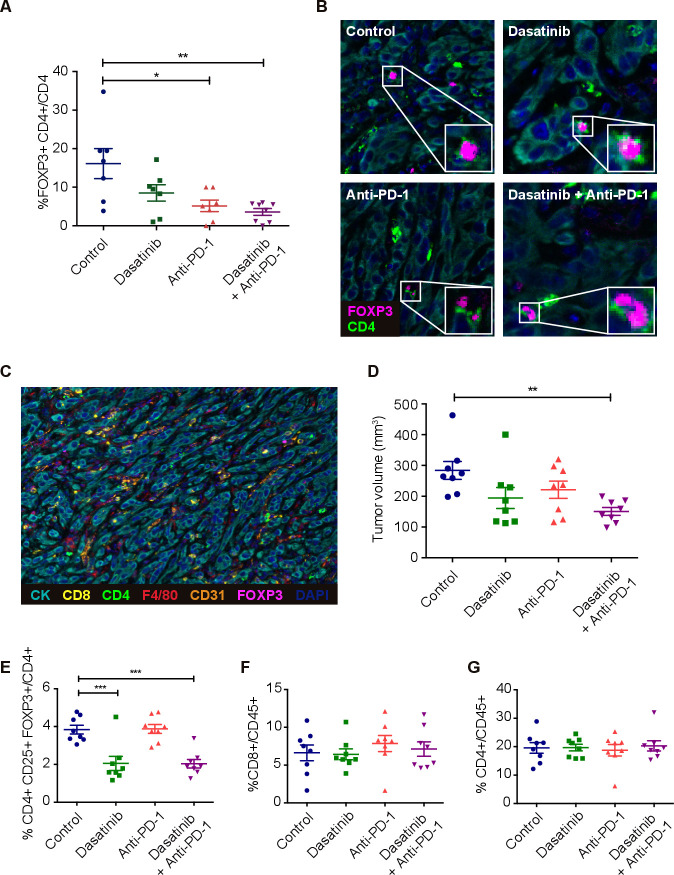
Figure 5.
(A) Quantification of cells coexpressing FOXP3 and CD4 (Treg cells) in 393P tumor microenvironment (n=8) analyzed by mIF. (B) Representative mIF images showing Treg cells in each group. (C) Example of an mIF landscape image showing CK+, CD8+, CD4+, F4/80+, CD31+ and FOXP3+ cells in one of these tumors. (D) 393P tumor volumes at the time (day 16) of the characterization of circulating immune cells by flow cytometry. (E–G) Percentage of Tregs (E), CD8+ (F) and CD4+ (G) cells in blood. Differences were analyzed with one-way analysis of variance followed by a post hoc Bonferroni test. *P<0.05, **P<0.01, ***P<0.001. mIF, multiplex immunofluorescence; PD-1, programmed cell death 1; Treg, regulatory T cell.

