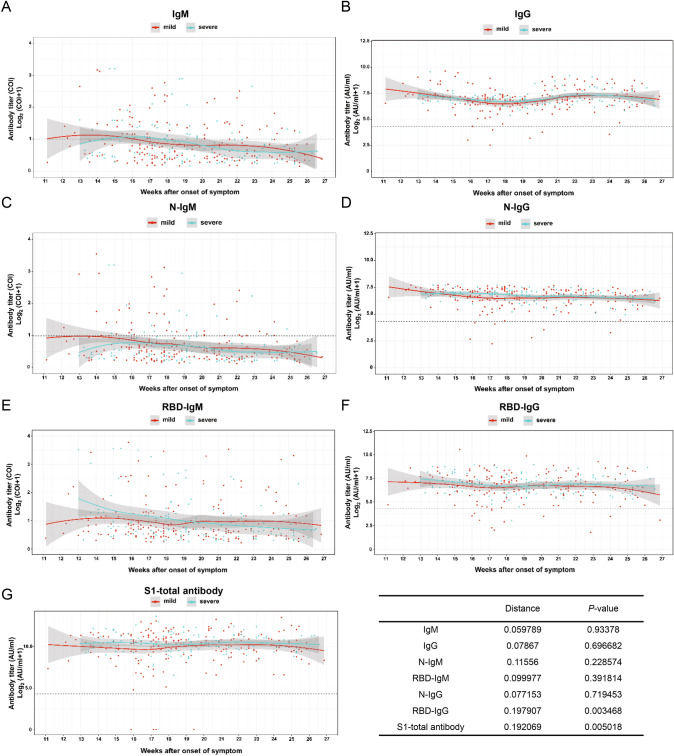
Fig. 5.
Comparison of humoral response in patients with mild and severe symptoms in convalescence A total of 326 samples was divided into mild and severe (including critical severe) groups. Except for IgM, IgG, N-IgM, N-IgG, RBD-IgM, the titer trends of RBD-IgG and S1-total antibody are significantly different between the two severity groups (P < 0.05). The trend line is fitted by LOESS and 95% confidence interval was shown in gray. The dashed line is the cutoff value. The inserted table summarizes the statistic data of the severity group.

