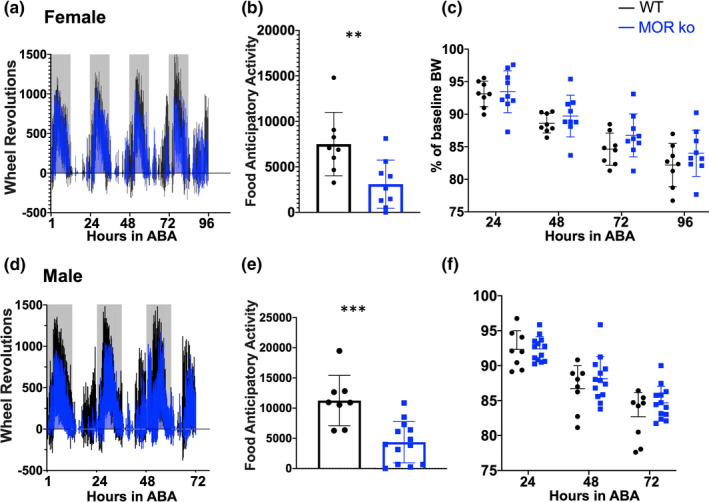
FIGURE 4.

Both male and female MOR knockout mice display blunted FAA. Wheel revolutions per 15‐minute time bin over the course of 3 days in ABA are shown for female (a) and male (d) mice. Gray bars denote the dark cycle. Highest daily total of FAA for each animal is shown in panels b (female: WT: n = 8, MOR ko: n = 9, **p = 0.0099, unpaired two‐tailed T test) and e (male: WT: n = 8, MOR ko: n = 13, ***p = 0.0006, unpaired two‐tailed T test). Daily bodyweight expressed as a percentage of the animal's baseline average are shown in panels c and F for females and males, respectively. Summary data presented as mean± SD. Data shown in panels c and f were analyzed repeated measures two‐way ANOVA. Additional details are found in the results section
