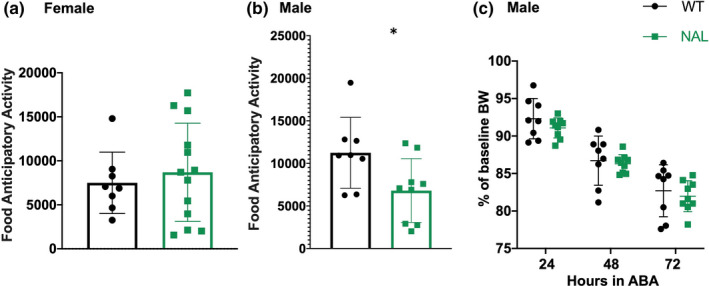
FIGURE 5.

Male, but not female, mice display reduced FAA in response to naloxone treatment. Highest daily FAA totals are shown for female (a, n = 13) and male (b, n = 9) mice undergoing ABA. Daily bodyweight expressed as a percentage of baseline average are shown for male mice (c). Control mice are shown in black; mice treated with naloxone (NAL) are shown in green. Summary data presented as mean ± SD. In panel b, *p = 0.0352. Unpaired two‐tailed T tests were used to analyze data shown in panels a and b; repeated measures two‐way ANOVA was used to analyze data shown in panel c. Additional details are found in the results section
