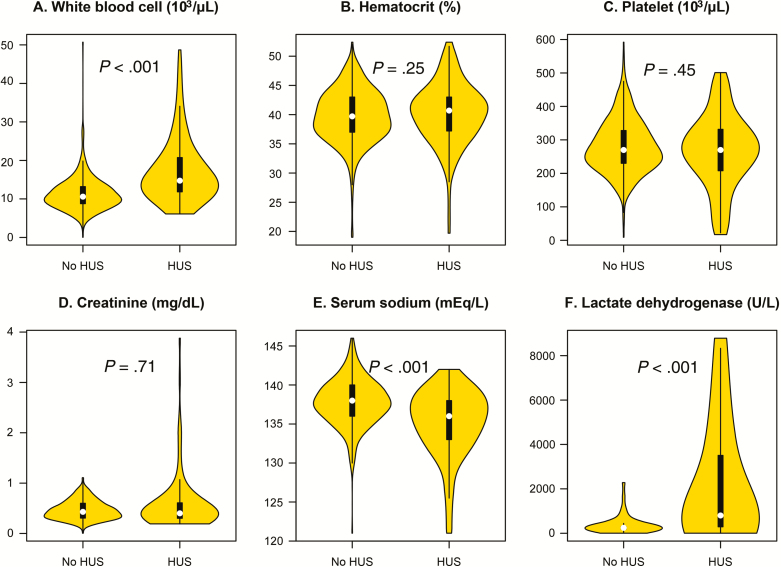
Figure 2.
Violin plots of white blood cell count, hematocrit, platelet, serum creatinine, serum sodium, and lactate dehydrogenase of children who did and those who did not develop HUS after the index emergency department visit. The white dot represents the median, the black vertical bar the interquartile range, the thin vertical line the 95% confidence interval, and the yellow shape the kernel density estimation (ie, distribution of data – wider sections = higher probability). Abbreviation: HUS, hemolytic uremic syndrome.

