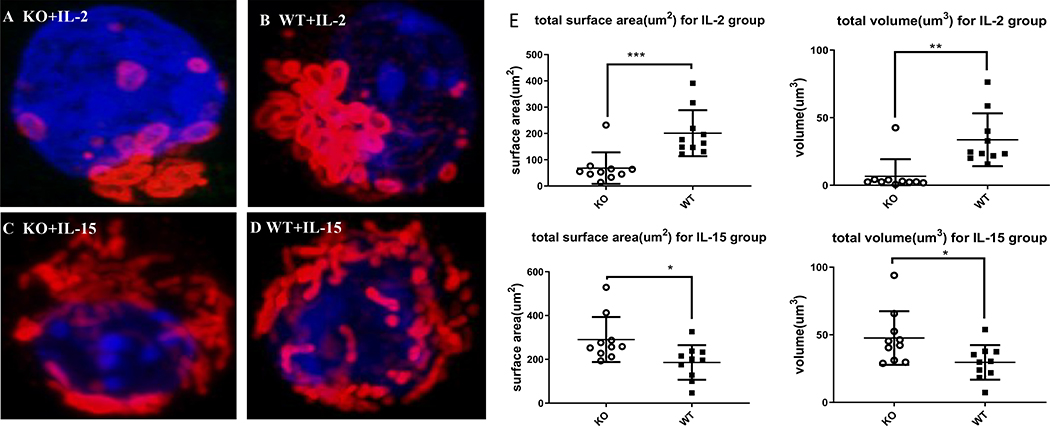
Figure 2. IL-15 differentiated memory CD8 T cells deficient in Zbtb20 have increased mitochondrial mass.
Cells were cultured as described in Figure 1, then analyzed by confocal microscopy. (A) Representative confocal image of KO OT-I T cells cultured with IL-2, (B) WT OT-I cells cultured with IL-2, (C) KO OT-I cells cultured with IL-15, (D) and WT OT-I cells cultured with IL-15. (E) Quantification of total mitochondrial surface area and volume in IL-2 or IL-15 treated groups. Quantification was determined on 3D reconstructed confocal images using Imaris software. Each point represents a single cell. Statistics were performed with Student’s unpaired t-test. *P<0.05, **P<0.01, ***P<0.001. Combined data from three experiments are shown.

