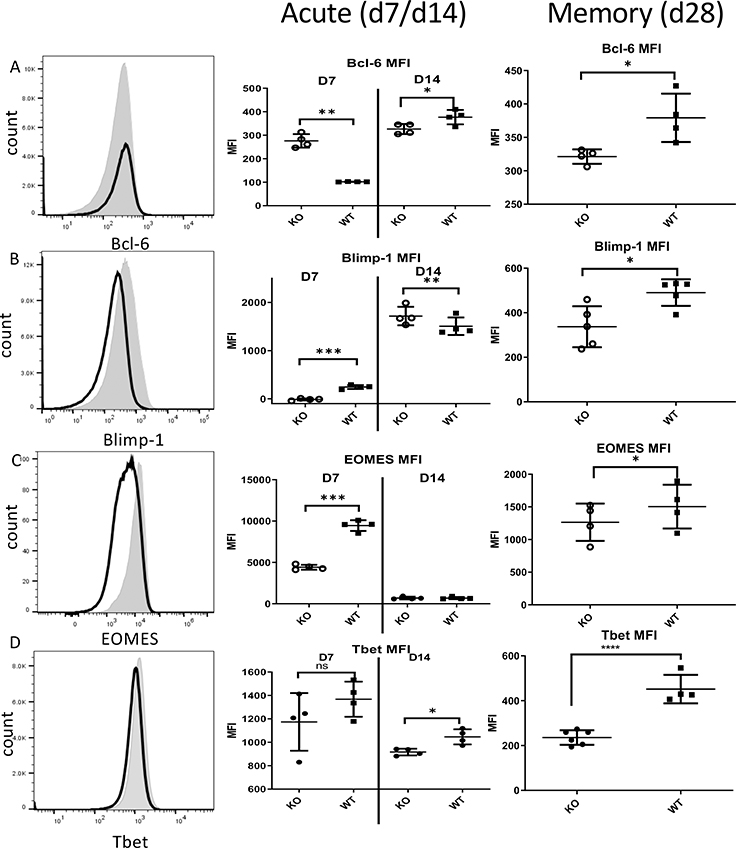
Figure 9. Zbtb20 deletion changes expression of key transcription factors in CD8 T cells during acute infection and in memory.
Splenocytes from mice treated as described in Fig. 6 were stained for expression of intranuclear transcription factors on days 7, 14 and 28 post-infection. Representative histograms from D7 are shown, together with quantification for all timepoints for (A) Bcl-6, (B) Blimp-1, (C) EOMES, and (D) T-bet staining. Shaded histogram – WT, empty histogram – Zbtb20 KO. Each point represents data from an individual mouse. Each group comprised at least four mice and each experiment was repeated three times. Statistics were performed using Student’s unpaired t-test. *P<0.05, ****P<0.0001.

