Figure 6.
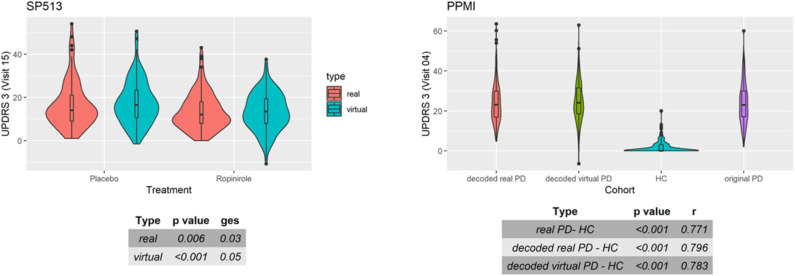
Distribution of UPDRS3 scores in SP513 (left) and Parkinson's Progression Markers Initiative (PPMI) (right). (Left) The plot depicts in red UPDRS3 scores of real SP513 patients under placebo and ropinirole at visit 15 (i.e., during treatment phase), respectively. In blue, the distribution of the UPDRS3 score in the same number of virtual patients is shown. Effect sizes and corresponding p-values obtained from two one-way ANOVAs comparing placebo and drug treatment in the real and virtual patients are shown in the tables at the bottom. Similar plots at other visits can be found in Section C of the Supplementary Materials (Right) Distribution of original (purple) and decoded (red) UPDRS3 scores of real PPMI de novo Parkinson's disease (PD) patients at visit 4 in comparison to PPMI healthy controls (blue). UPDRS3 scores of virtual PD patients are shown in yellow. The table at the bottom shows differences in UPDRS3 scores between original PD, decoded real PD, and virtual PD patients compared to PPMI healthy controls, showing p-value and effect size from three Mann-Whitney U-tests. Similar plots at other visits can be found in Section C of the Supplementary Materials.

