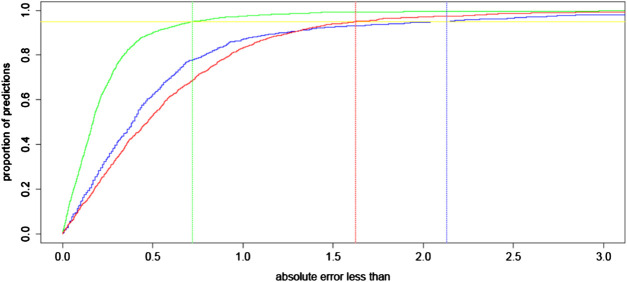
FIGURE 2.
A regression error characteristic curve for the absolute error of intraocular lens (IOL) power (in D) for BART (green), the RBF 1.0 calculator (blue), and the SRK/T formula (red) for 1,000 eyes out-of-sample. To interpret this illustration, consider the example of eyes with 0.5 D or less absolute error in their predictions for IOL power. Approximately 90% of BART’s predictions have this level of precision, while approximately 60% of the RBF 1.0 calculator’s predictions and 55% of predictions with the SRK/T formula have such precision. The vertical lines represent the maximum absolute error for 95% of predictions in all three compared approaches.

