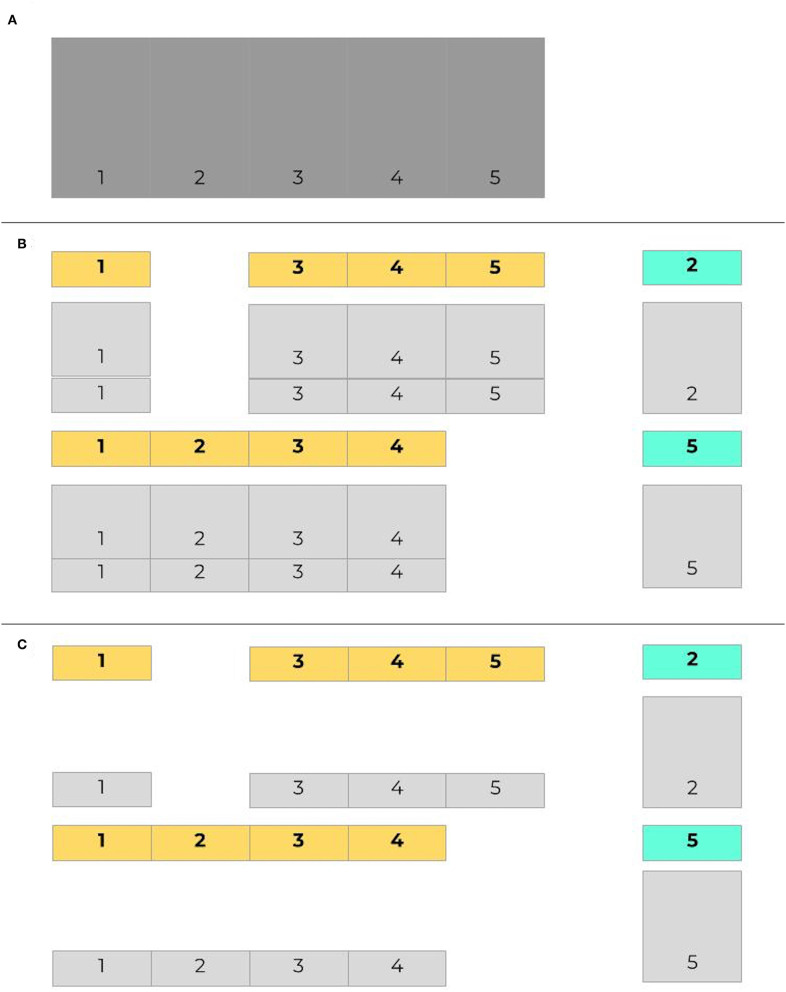
Figure 3.
Imbalanced data in cross validation, with balanced training sets. Given the same initial set of data as in Figure 2 (A), here in (B) cases are labeled in bold, with controls shaded light gray. The proportion of controls outnumbers the proportion of cases in both training and testing sets. When training data is balanced (C), controls are sampled to provide an even split between training cases and training controls.

