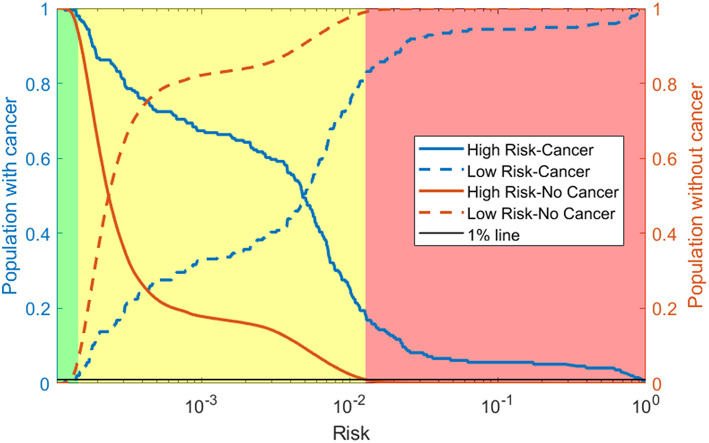
Figure 5.
Risk stratification: cumulative distribution functions (CDFs) of the percentage of the population with cancer (blue lines) and without cancer (orange lines) classified as high risk (solid line) and low risk (dashed line) as the risk boundaries vary. We selected the boundaries based on where the 1% (black line) intersects the high-risk CDF for those without cancer and the low risk CDF for those with cancer. This gives the high (red), medium (yellow), and low (green) risk regions.

