FIGURE 2.

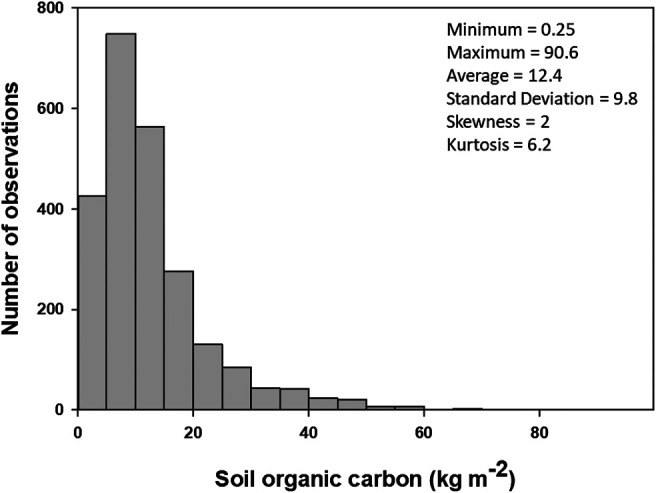
Histogram and descriptive statistics of surface soil organic carbon stocks (0–30 cm) observations used in this study (n = 2,374).

Histogram and descriptive statistics of surface soil organic carbon stocks (0–30 cm) observations used in this study (n = 2,374).