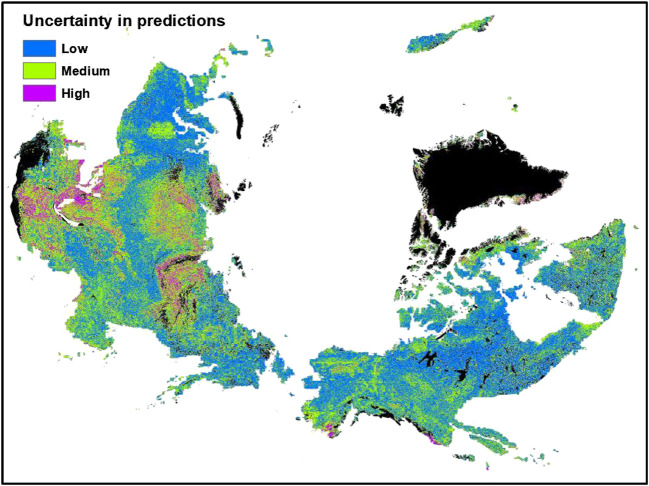
FIGURE 5.
Distribution of uncertainties in the predicted surface soil organic carbon stocks of the northern circumpolar permafrost region. Blue color shows areas with <20% uncertainty, green color shows areas with 20–49% uncertainty and purple color shows areas with >50% uncertainty in the predicted SOC stocks. Areas in black color show water surface or perennial ice, urban, and barren land with consolidated materials.

