Figure 2.

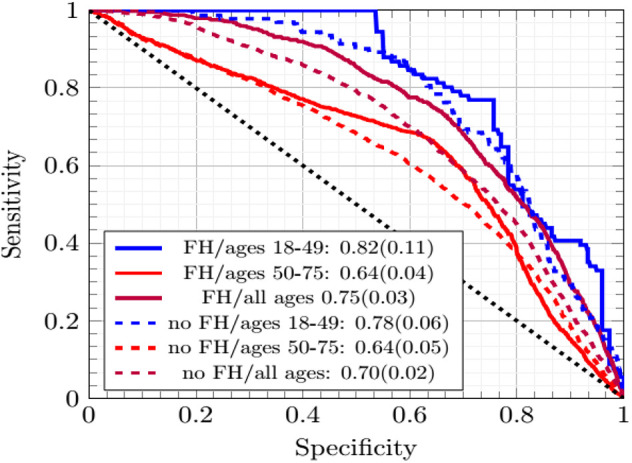
The ROC curves of the ANNs averaged across cross-testing for different sub-demographics and with/without family history data.

The ROC curves of the ANNs averaged across cross-testing for different sub-demographics and with/without family history data.